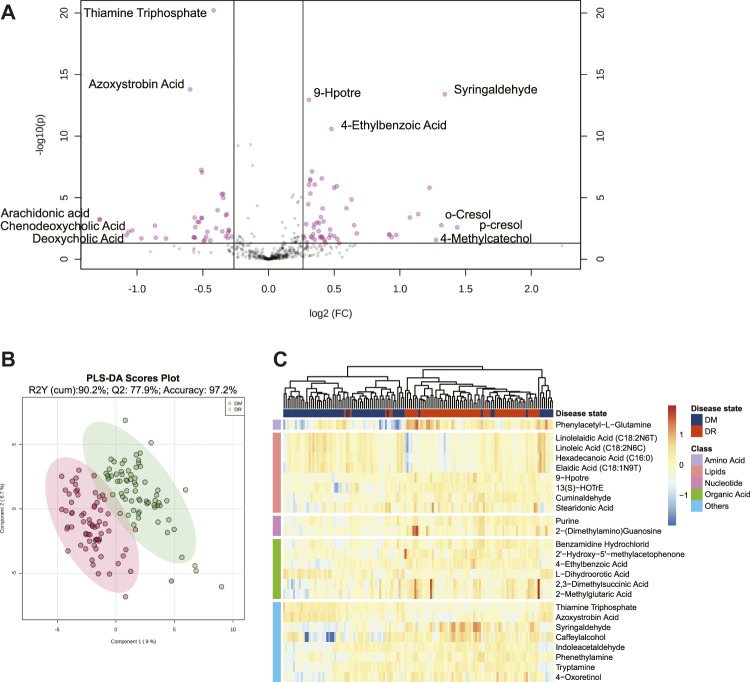
FIGURE 1.
(A) Volcano plot of metabolites between DM and DR patients (FDR <0.05; fold changes >1.2 or <0.8). (B) PLS-DA score plot. The model was established using three principal components. Cumulative R2 archived 90.2%, Q2 achieved 77.9%, and accuracy achieved 97.2% with permutation test p-values less than 0.001. (C) Heatmap for intensities of top 25 differentially expressed metabolites between DM and DR patients with the smallest paired t-test FDR q value. Euclidean distance metric and Ward’s clustering method were applied for the hierarchical clustering. Red represents increased intensities and blue decreased intensities. Abbreviations: DM, type 2 diabetes mellitus (T2DM) without diabetic retinopathy; DR, T2DM with diabetic retinopathy; PLS-DA, partial least squares discriminant analysis; FDR, false discovery rate.

