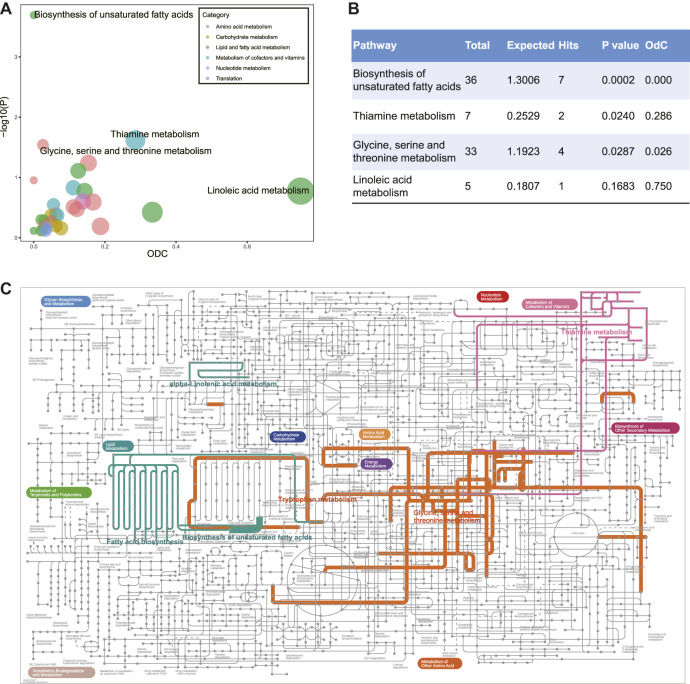
FIGURE 2.
(A) Metabolic pathway analysis of differentially expressed metabolites between DM and DR patients. Y-axis shows -lg(p) calculated by hypergeometric test using over-representation analysis. X-axis and the size show out-degree centrality using pathway topology. The color represents different categories of metabolic pathways. (B) Statistic table for enriched metabolic pathways. (C) KEGG global metabolic network highlighting DR altered pathways (p-value < 0.05). The thickness of the line represents the number of enriched metabolites in the pathway. Abbreviations: DM, type 2 diabetes mellitus (T2DM) without diabetic retinopathy; DR, T2DM with diabetic retinopathy; KEGG, Kyoto Encyclopedia of Genes and Genomes database.

