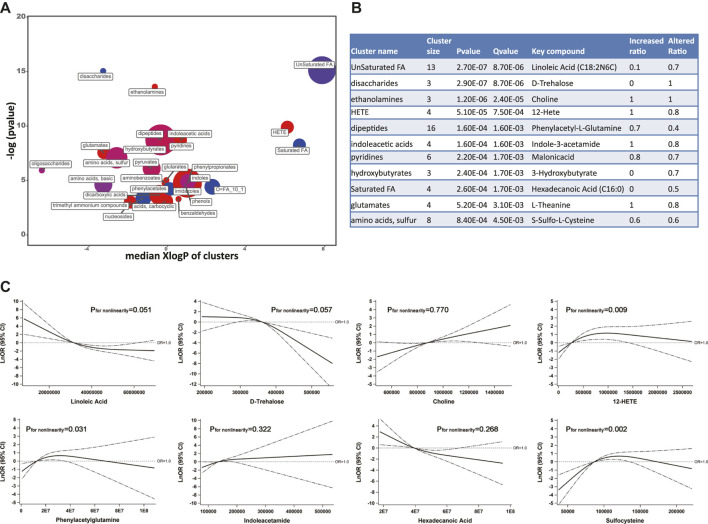
FIGURE 3.
(A) ChemRICH analysis showed the most significantly altered metabolite clusters based on chemical similarity. Cluster size indicates the number of metabolites in each cluster. The proportion of increased or decreased metabolites compared to DM patients are shown by color (red = increased, purple = partly decreased, blue = decreased). Chemical enrichment statistics were calculated by the Kolmogorov–Smirnov test and only enrichment clusters with p < 0.05 are shown in the bubble plot. (B) Statistics table for metabolite clusters (adjusted q value <0.01). (C) Associations of key metabolites with the odds (natural log-transformed) of DR after adjusting for systolic blood pressure, duration of diabetes, and insulin treatment history. Abbreviations: ChemRICH, Chemical Similarity Enrichment Analysis for Metabolites; DM, type 2 diabetes mellitus (T2DM) without diabetic retinopathy; DR, T2DM with diabetic retinopathy; KEGG, Kyoto Encyclopedia of Genes and Genomes database.

