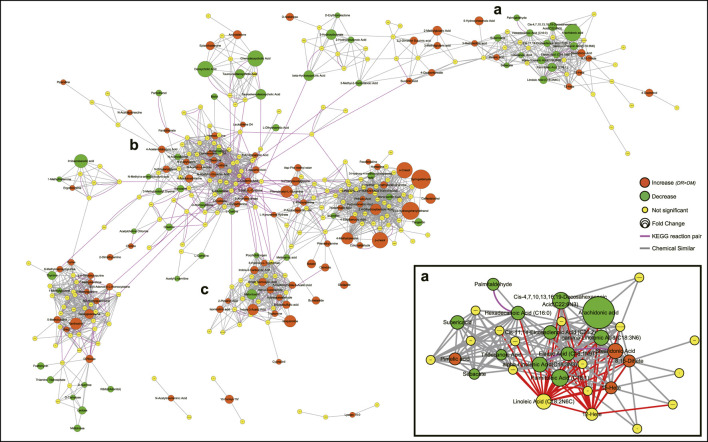
FIGURE 4.
Metabolic network visualizing by MetaMapp. Orange nodes indicate increased metabolites in DR patients compared to DM patients, while the green nodes indicate a decrease. Node size indicates the magnitude of fold change. Purple edges denote KEGG reactant pair links, and grey edges symbolize Tanimoto chemical similarity over 700. Module a mainly includes PUFAs and their derivatives, module b mainly includes amino acids, module c includes indole and its derivatives. Abbreviations: DR, type 2 diabetes mellitus (T2DM) with diabetic retinopathy; DM, T2DM without diabetic retinopathy; KEGG, Kyoto Encyclopedia of Genes and Genomes database.

