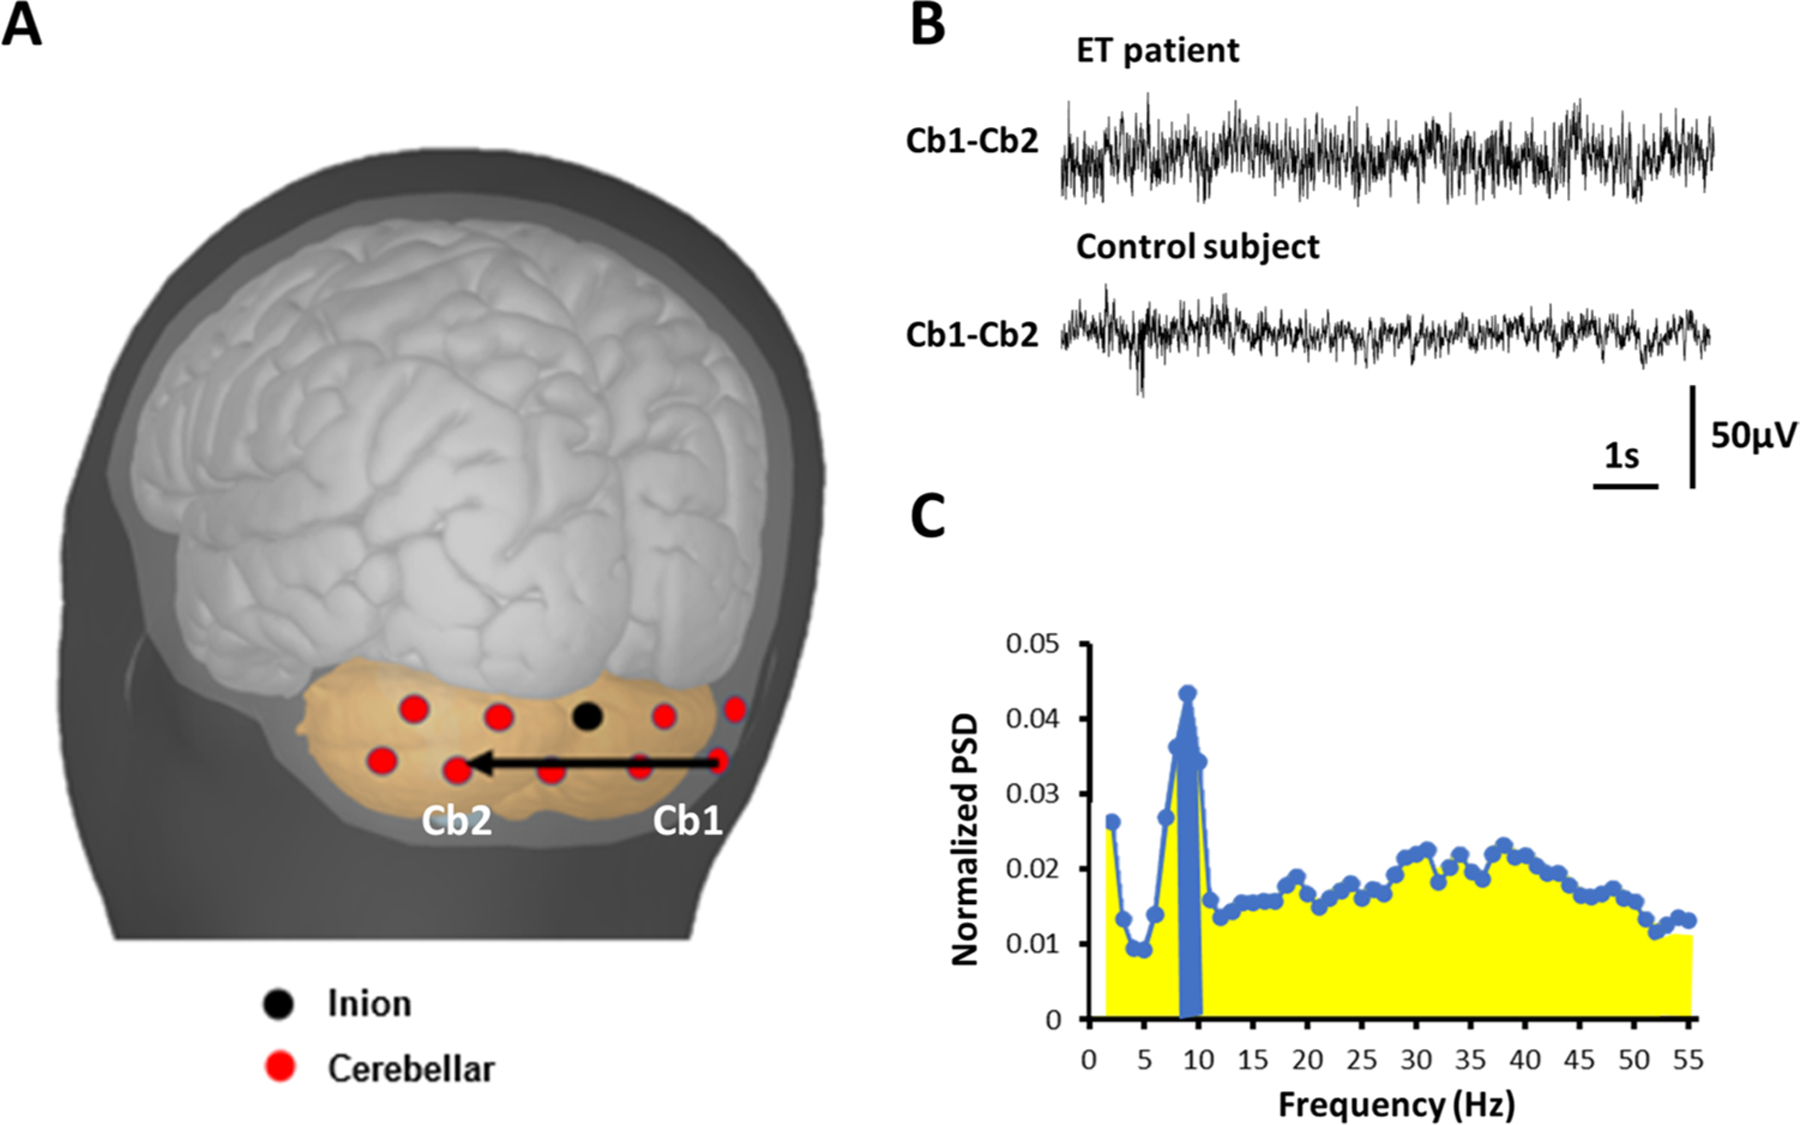
Fig. 1.

A Schematic of the surface cerebellar electroencephalogram. Cerebellar electrodes (red) were placed below the inion (black dot), over the surface of the cerebellar region. B Representative raw traces of cerebellar electroencephalogram. C After transformation, the power spectrum density (PSD) of each frequency was calculated. We summed up the PSD of the peak and the two adjacent frequencies (± 1 Hz to the peak, blue), divided the sum by the total PSD between 2 and 55 Hz (yellow, only up to 30 Hz was shown), and scaled by 100 to calculate the cerebellar oscillatory index
