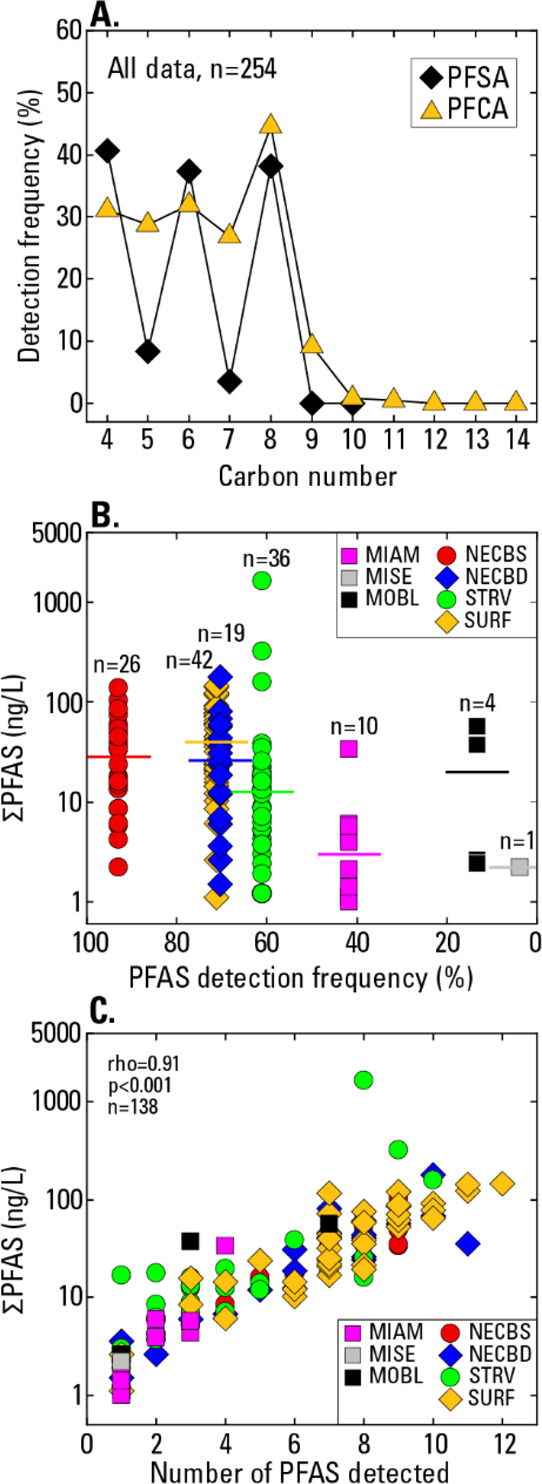
Figure 2.

(A) Detection frequency for perfluoroalkyl sulfonates (PFSA) and perfluoroalkyl carboxylates (PFCA) in relation to the carbon number, based on all data, (B) ΣPFAS in relation to PFAS detection frequency by the well network, and (C) ΣPFAS in relation to the number of PFAS detected in samples. In (B), the horizontal lines show median concentrations; n is the number of samples with at least one PFAS detection. In (B and C), ΣPFAS is the summed concentration of detected PFAS.
