Figure 4.

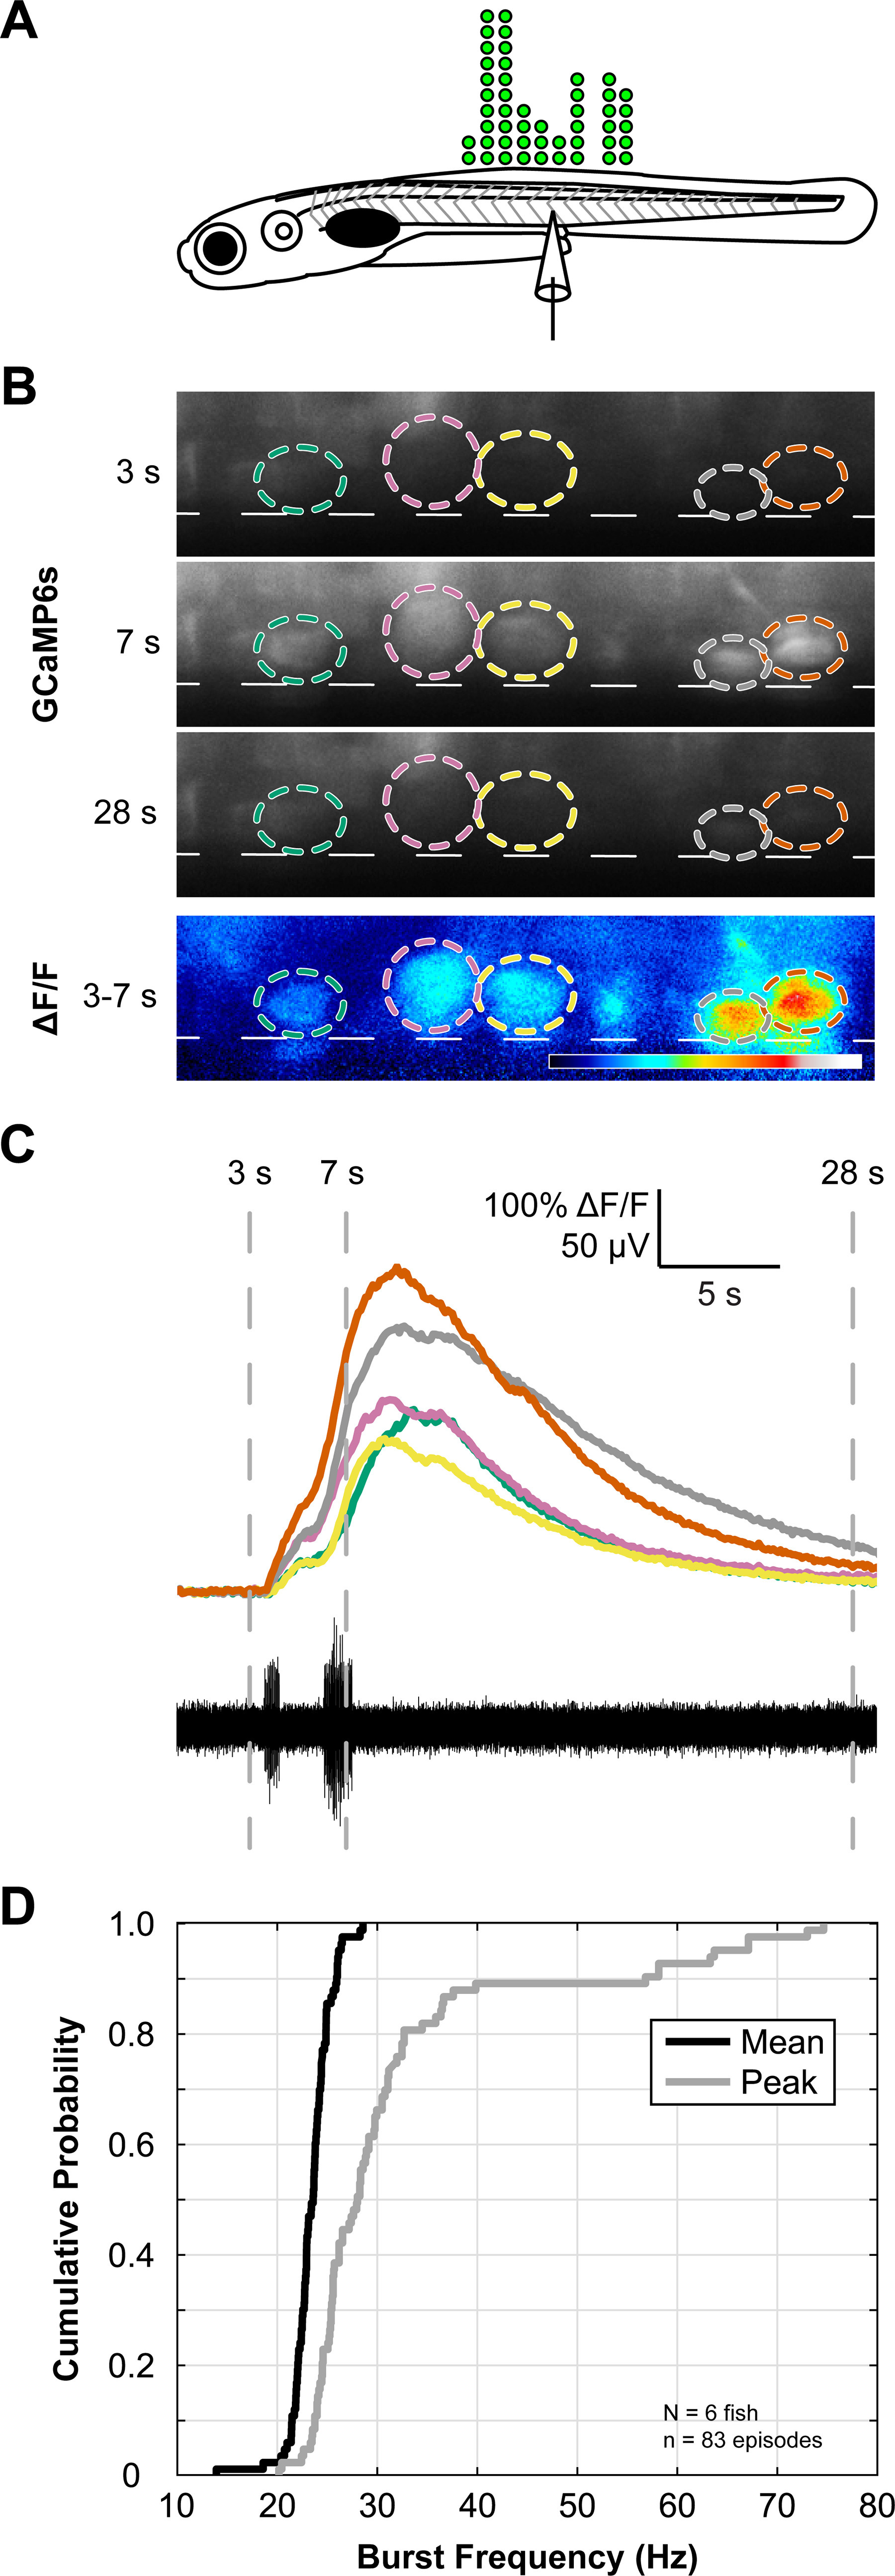
V3-IN activity is temporally correlated to fictive locomotion. A, Schematic representing the number and distribution of V3-INs (green circles) along the rostrocaudal axis of the spinal cord monitored during calcium imaging experiments. B, Each V3-IN in the field of view in Tg(vglut2a:Gal4ff)nns20;Tg(UAS:GCaMP6s)nk13a double transgenic larvae was assigned a ROI during spontaneous fictive swimming. Panels in B show raw GCaMP6s fluorescence (F) and correspond to numbered time points in C. Bottom panel in B shows calculated ΔF/F between 3- and 7-s time points. Dashed lines represent ventral boundary of the spinal cord. C, Synchronized recordings of GCaMP6s fluorescence (top) and fictive swimming (bottom) allowed identification of swimming-related neuronal activity. D, Plots of cumulative probability distributions for Mean (black line) and Peak (gray line) burst frequencies.
