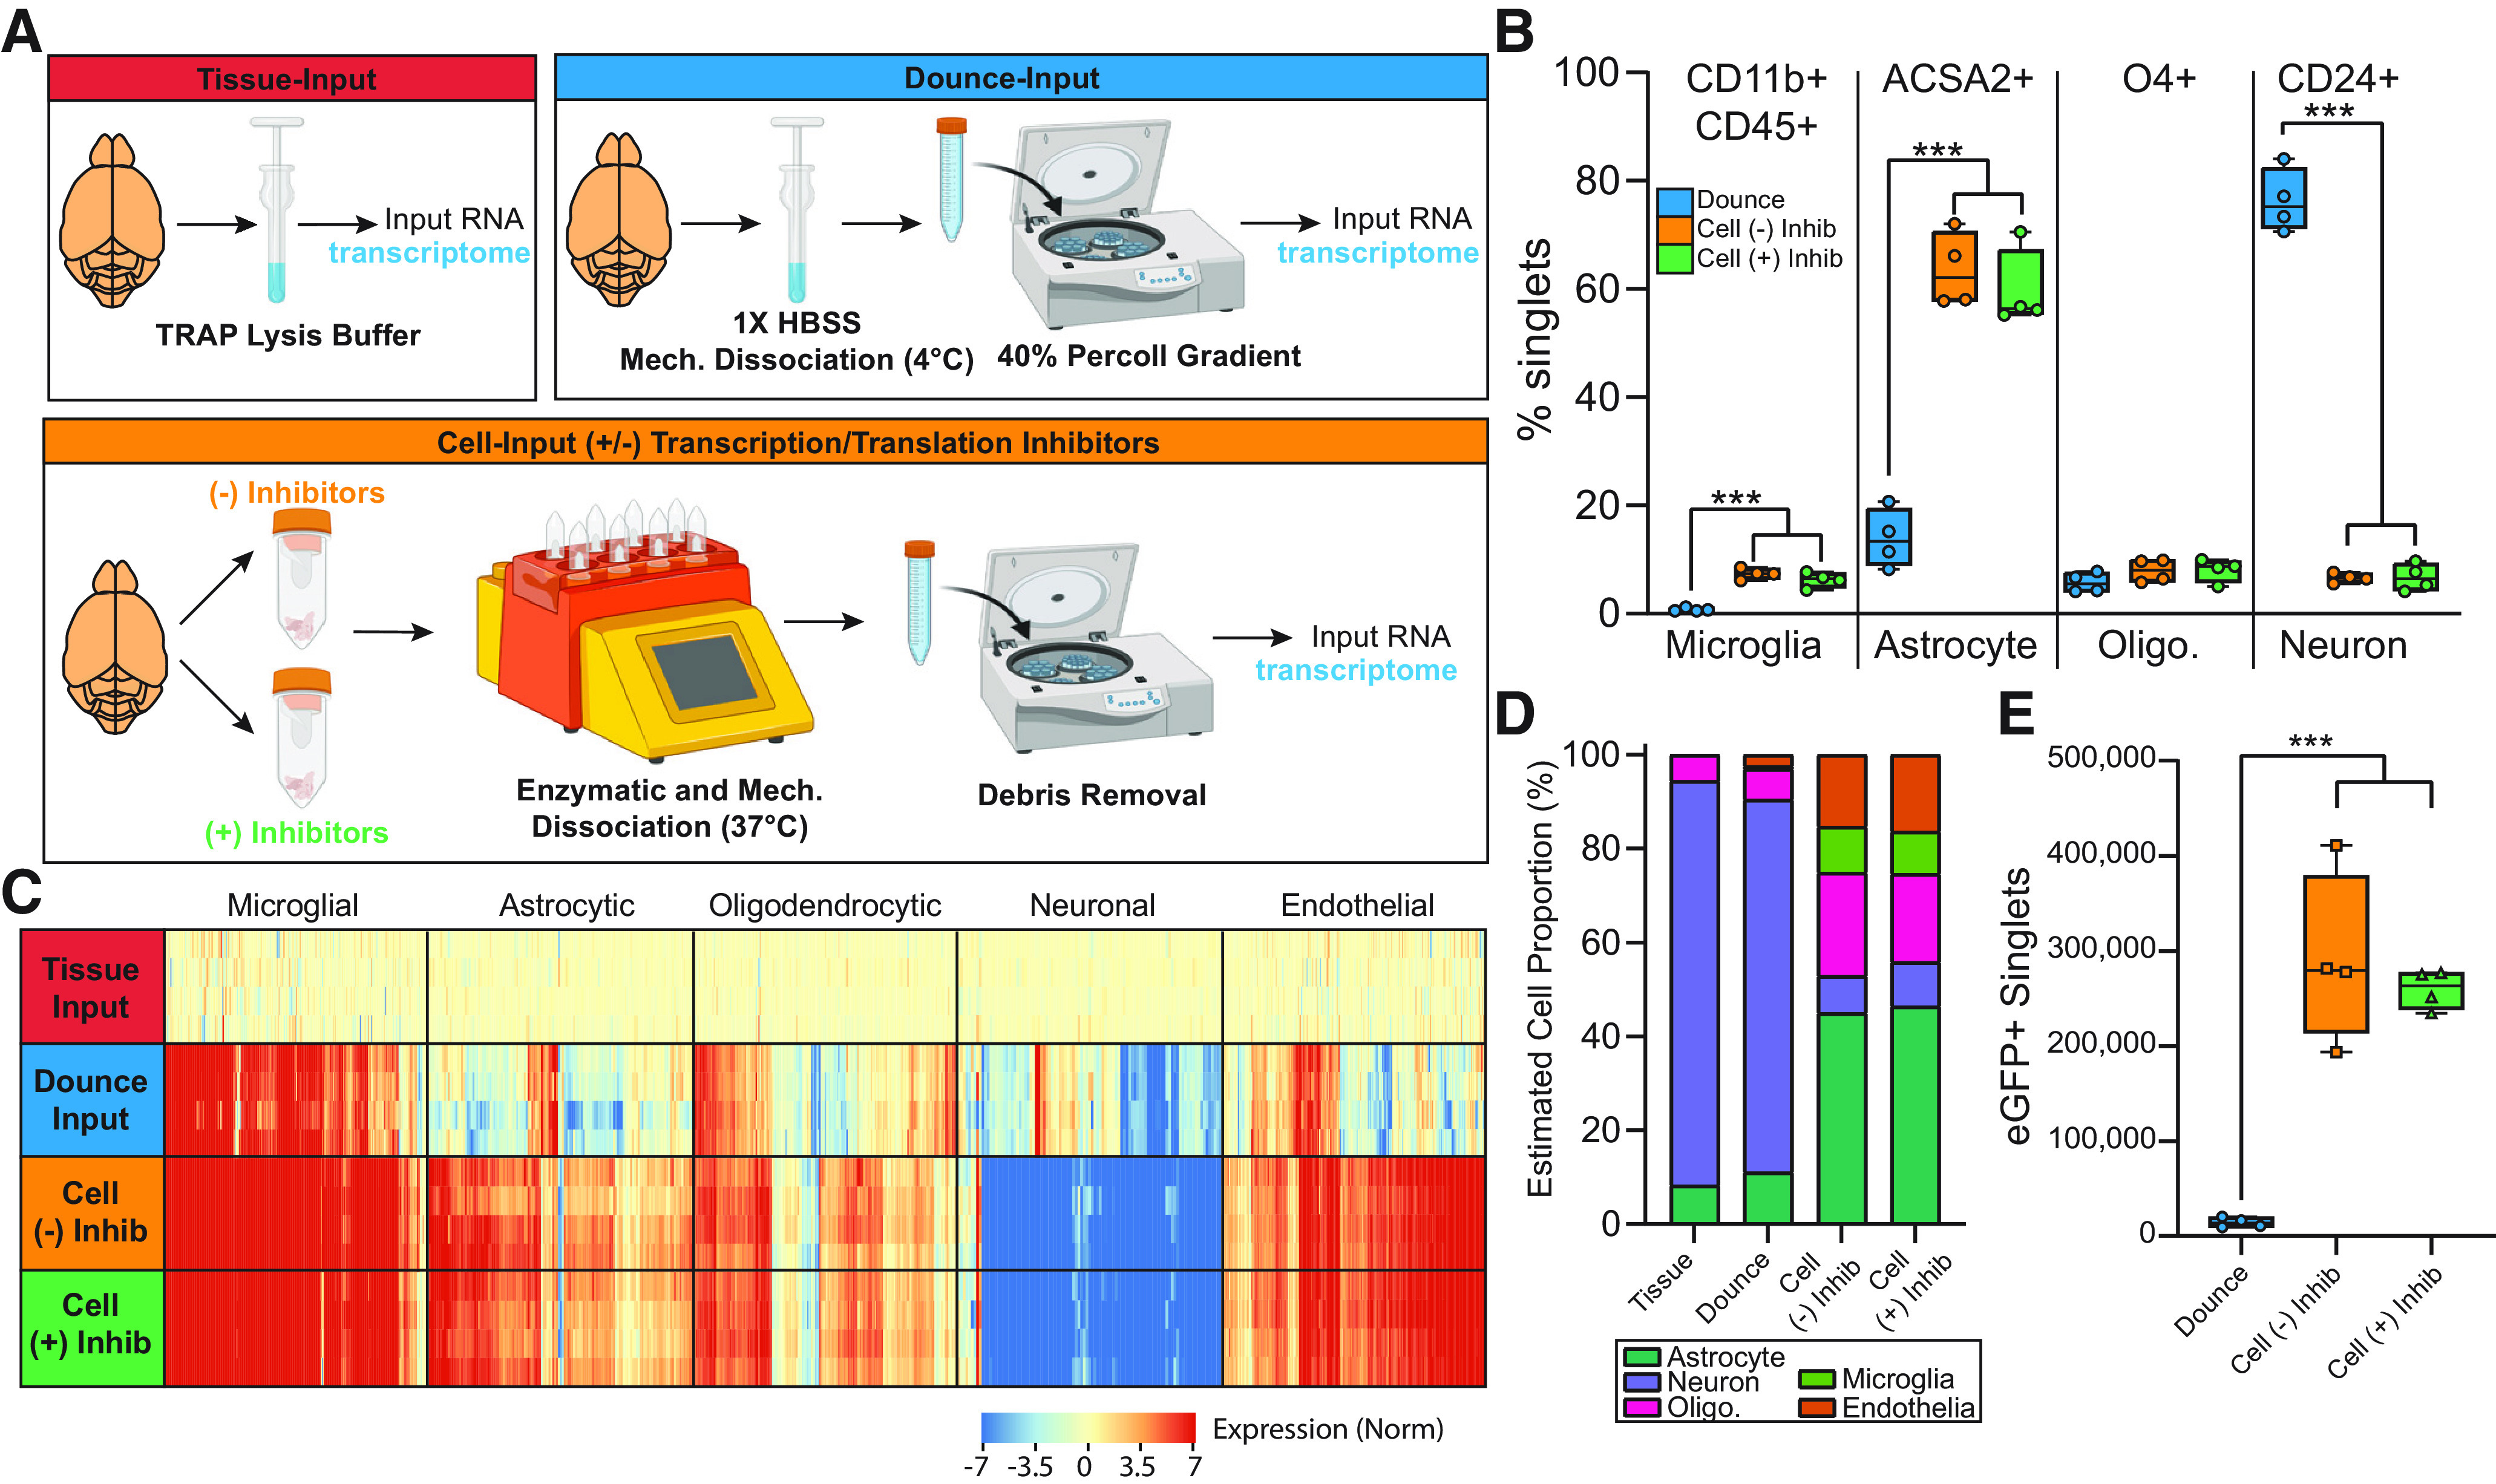
Figure 6.

Changes in cellularity based on cell preparation method. Cx3cr1-NuTRAP brains were hemisected and single-cell suspensions were generated by three different methods. Cell preparations were compared via flow cytometry and transcriptomic analyses. The three cell preparation methods were also compared with whole tissue using transcriptomic analysis. Basic sequencing metrics and all source data for Figure 6 are provided in Extended Data Figure 6-1. Gene body coverage plots showed greater 3′ bias in the Tissue- and Dounce-Input groups than the Cell-Input (+/−) Inhibitors groups (Extended Data Fig. 6-2). A, Schematic of experimental design presented in this figure. B, Flow cytometry on cell type-specific markers for microglia (CD11b+CD45+), astrocytes (ACSA2+), oligodendrocytes (O4+), and neurons (CD24+) for each of the cell preparation methods (one-way ANOVA, Tukey’s post hoc test, ***p < 0.001). Representative gating strategies for flow cytometry are provided in Extended Data Figure 6-3. C, Heatmap of cell type-specific markers for microglia, astrocytes, oligodendrocytes, neurons, and endothelial cells. D, CIBERSORTx cellularity estimates based on whole-transcriptome RNA-Seq from whole brain tissue and each of the cell preparation techniques. E, Comparison of the number of eGFP+ singlets in each half brain for each of the cell preparation methods (one-way ANOVA, Tukey’s post hoc test, ***p < 0.001). There was no overall difference in cell viability between different cell preparation methods. eGFP+ cells had slightly higher viability in the Cell-Input (+/−) Inhibitors than the Dounce-Input method (Extended Data Fig. 6-4). Boxplots represent median, Q1, Q3, minimum, and maximum of each dataset. Created with BioRender.com.
