Figure 3.
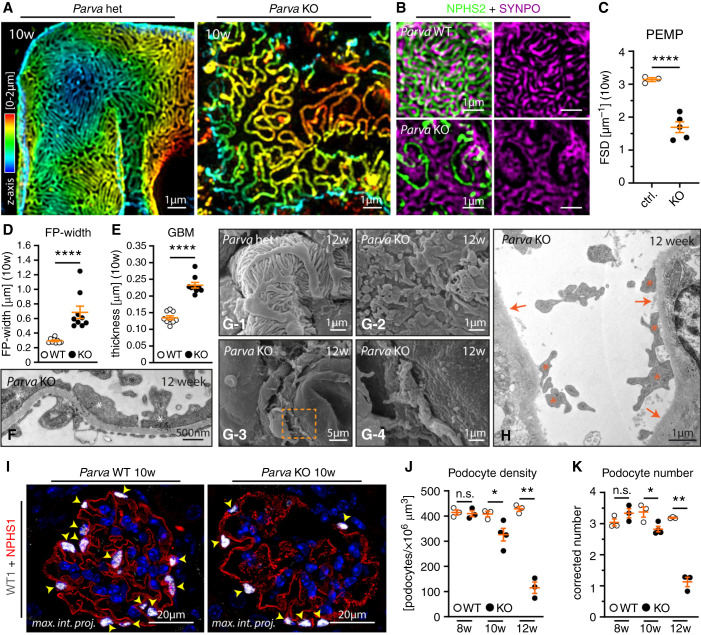
PARVA prevents podocyte detachment from the GBM. (A–C) 3D-SIM in respective KO animals identified a reduced filtration slit density (FSD) indicative for aberrant FP architecture (SIM data of 3 control: two WT, one heterozygous, and five KO animals were quantified by PEMP). Z-axis scales of 3D-SIM were color coded as indicated. (D–F) TEM of respective KO and WT animals demonstrated significant retraction and simplification of podocyte FPs in podocytes from KO mice (FP effacement, white asterisk). These changes were accompanied by rarefication of slit diaphragm density (three animals per time point and genotype were analyzed for mean FP width and GBM thickness; dots indicate individual glomeruli; see Supplemental Figure 5 for additional images of WT and KO animals). (G) and (H) SEM and TEM studies at 12 weeks of age showed a pronounced denudation of the GBM due to ongoing podocyte detachment (orange dotted squared box indicates areas of zoom-in; orange asterisks highlight residual fragments of persistently linked podocyte FPs to the GBM; orange arrows indicate areas of completely denuded GBM). (I) IF microscopy employing NPHS1 to highlight the podocyte compartment, and WT1 as a specific nuclear marker for podocytes (yellow arrowheads mark individual podocyte nuclei in WT and respective KO animals). (J) and (K) Quantification of podocyte numbers at 8, 10, and 12 weeks after birth revealed a progressive decrease in parameters such as podocyte density (J) and corrected podocyte numbers (K) (each individual dot represents one experimental animal, at least three animals per time point and genotype were analyzed). *P<0.05, **P<0.01 and ****P<0.0001.

