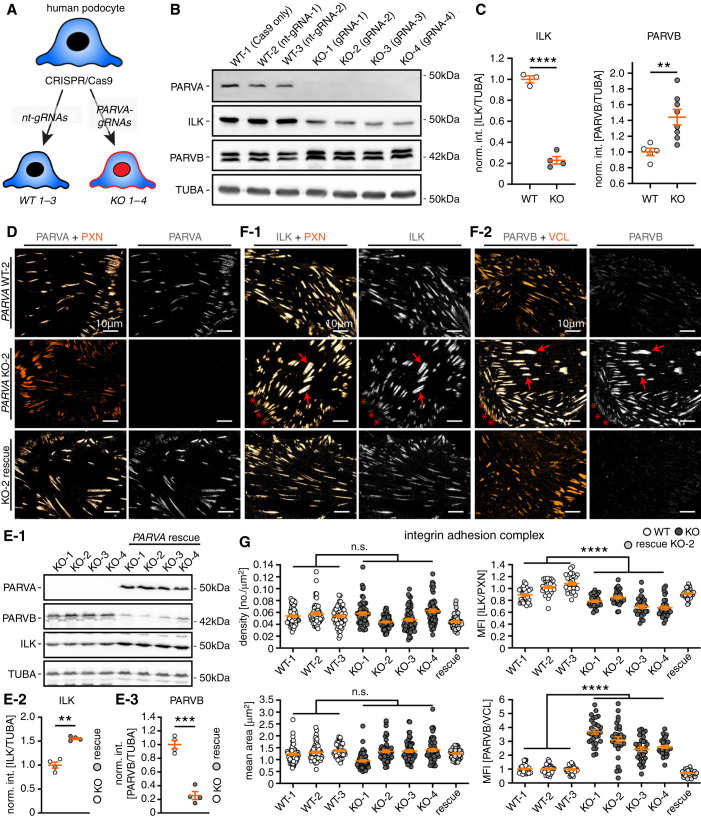
Figure 4.
Parvin proteins exhibit compensatory recruitment toward IAC. (A) Schematic describing the CRISPR/Cas9-based genome editing strategy to generate specific KOs for PARVA in immortalized human podocytes (nt-gRNA, nontargeting guide RNA; note, numbers 1–3 and 1–4 indicate respective clones for individual gRNAs). (B) and (C) Western blot analysis for PARVA, ILK, and PARVB confirmed complete abolishment of PARVA protein levels in respective individual KO clones from four independent gRNAs. In addition, ILK levels were significantly reduced whereas PARVB protein levels showed a compensatory increase in respective KO cells (dots represent individual cell lines; for PARVB two independent replicates for each cell line were combined for statistical analysis, int., intensity, norm., normalized to WT). (D) The specific localization of PARVA to the subcellular IAC compartment was demonstrated by costaining with PXN in either WT, PARVA deleted, or rescued KO cells (upper and lower panel, respectively). (E) Re-expression of a flag-tagged version of PARVA in PARVA KO 1–4 clones not only restored PARVA protein levels, but also reversed ILK decrease and PARVB compensatory responses (TUBA, tubulin alpha used as a loading control; dots represent individual cell lines; int., intensity; norm., normalized to KO). (F) IF imaging for ILK and PARVB localization patterns revealed only slightly decreased recruitment of ILK toward IACs accompanied by strongly increased recruitment of PARVB (red arrows indicated IACs with strong colocalization patterns for individual IAC proteins; PXN or VCL was used as IAC marker). (G) Morphometric analyses demonstrated that PARVA deficient cells do not exhibit significant alterations in numbers and mean size of IACs (individual dots represent 60 analyzed cells per clone; two independent experiments for morphometric measurements were conducted and 30 cells per clone and experiment were analyzed). Ratiometric imaging for ILK and PARVB mean fluorescence intensity (MFI) levels demonstrated significant differences in localization toward the IAC depending on PARVA (MFIs were normalized to the mean of WT clones; individual dots for ILK and PARVA MFI measurements represent 30 analyzed cells per clone of one representative experiment, respectively). Cells of WT and KO clones were pooled for statistical testing. **P<0.01, ***P<0.001, and ****P<0.0001.

