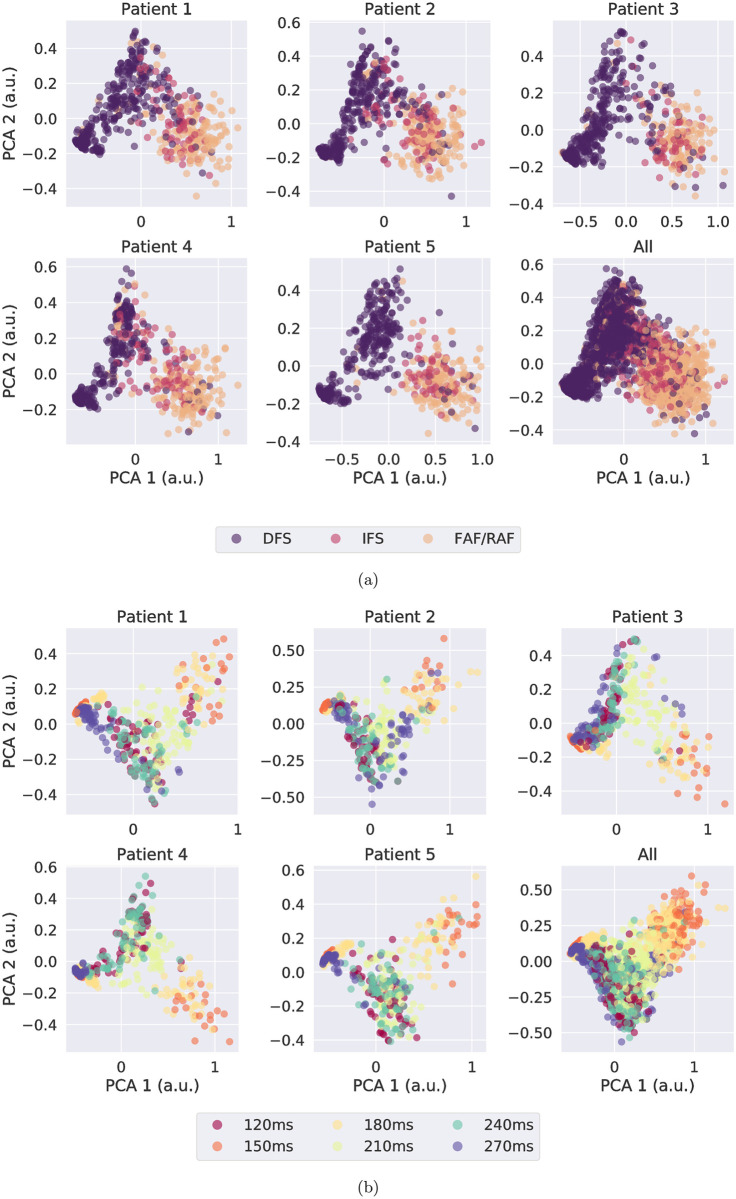
Fig 7. Two-dimensional PCA representation of MaxAC values obtained from SO-BSS with K = 10 over simulated BSPMs), on each patient and all pooled, for different colour-coded groupings: (a) all categories over all episodes, and (b) focal CLs over all FS episodes.
Clustering based on categories and focal CLs can be seen for each patient. a.u.: arbitrary unit.

