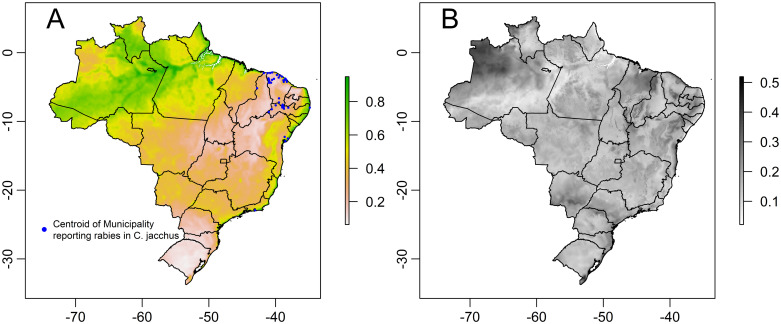
Fig 5. Model predictions on Callithrix jacchus suitable area in Brazil.
(A) Predicted suitable areas of Callithrix jacchus across Brazil (median values of the best fitting model). Areas in darker red indicate higher suitable areas predicted by the best Maxent model. Blue dots represent the centroid of municipalities that have reported a rabies case in C. jacchus (B) Uncertainty associated with the predicted suitable areas of Callithrix jacchus in Brazil. Uncertainty is represented by the range of the model predictions (max-min). Country, region and district maps were obtained from the GADM (http://www.gadm.org//) database, freely-available for academic use, using the getData function from the raster package of R (map layer can be found here: https://biogeo.ucdavis.edu/data/gadm3.6/Rsp/gadm36_BRA_2_sp.rds).

