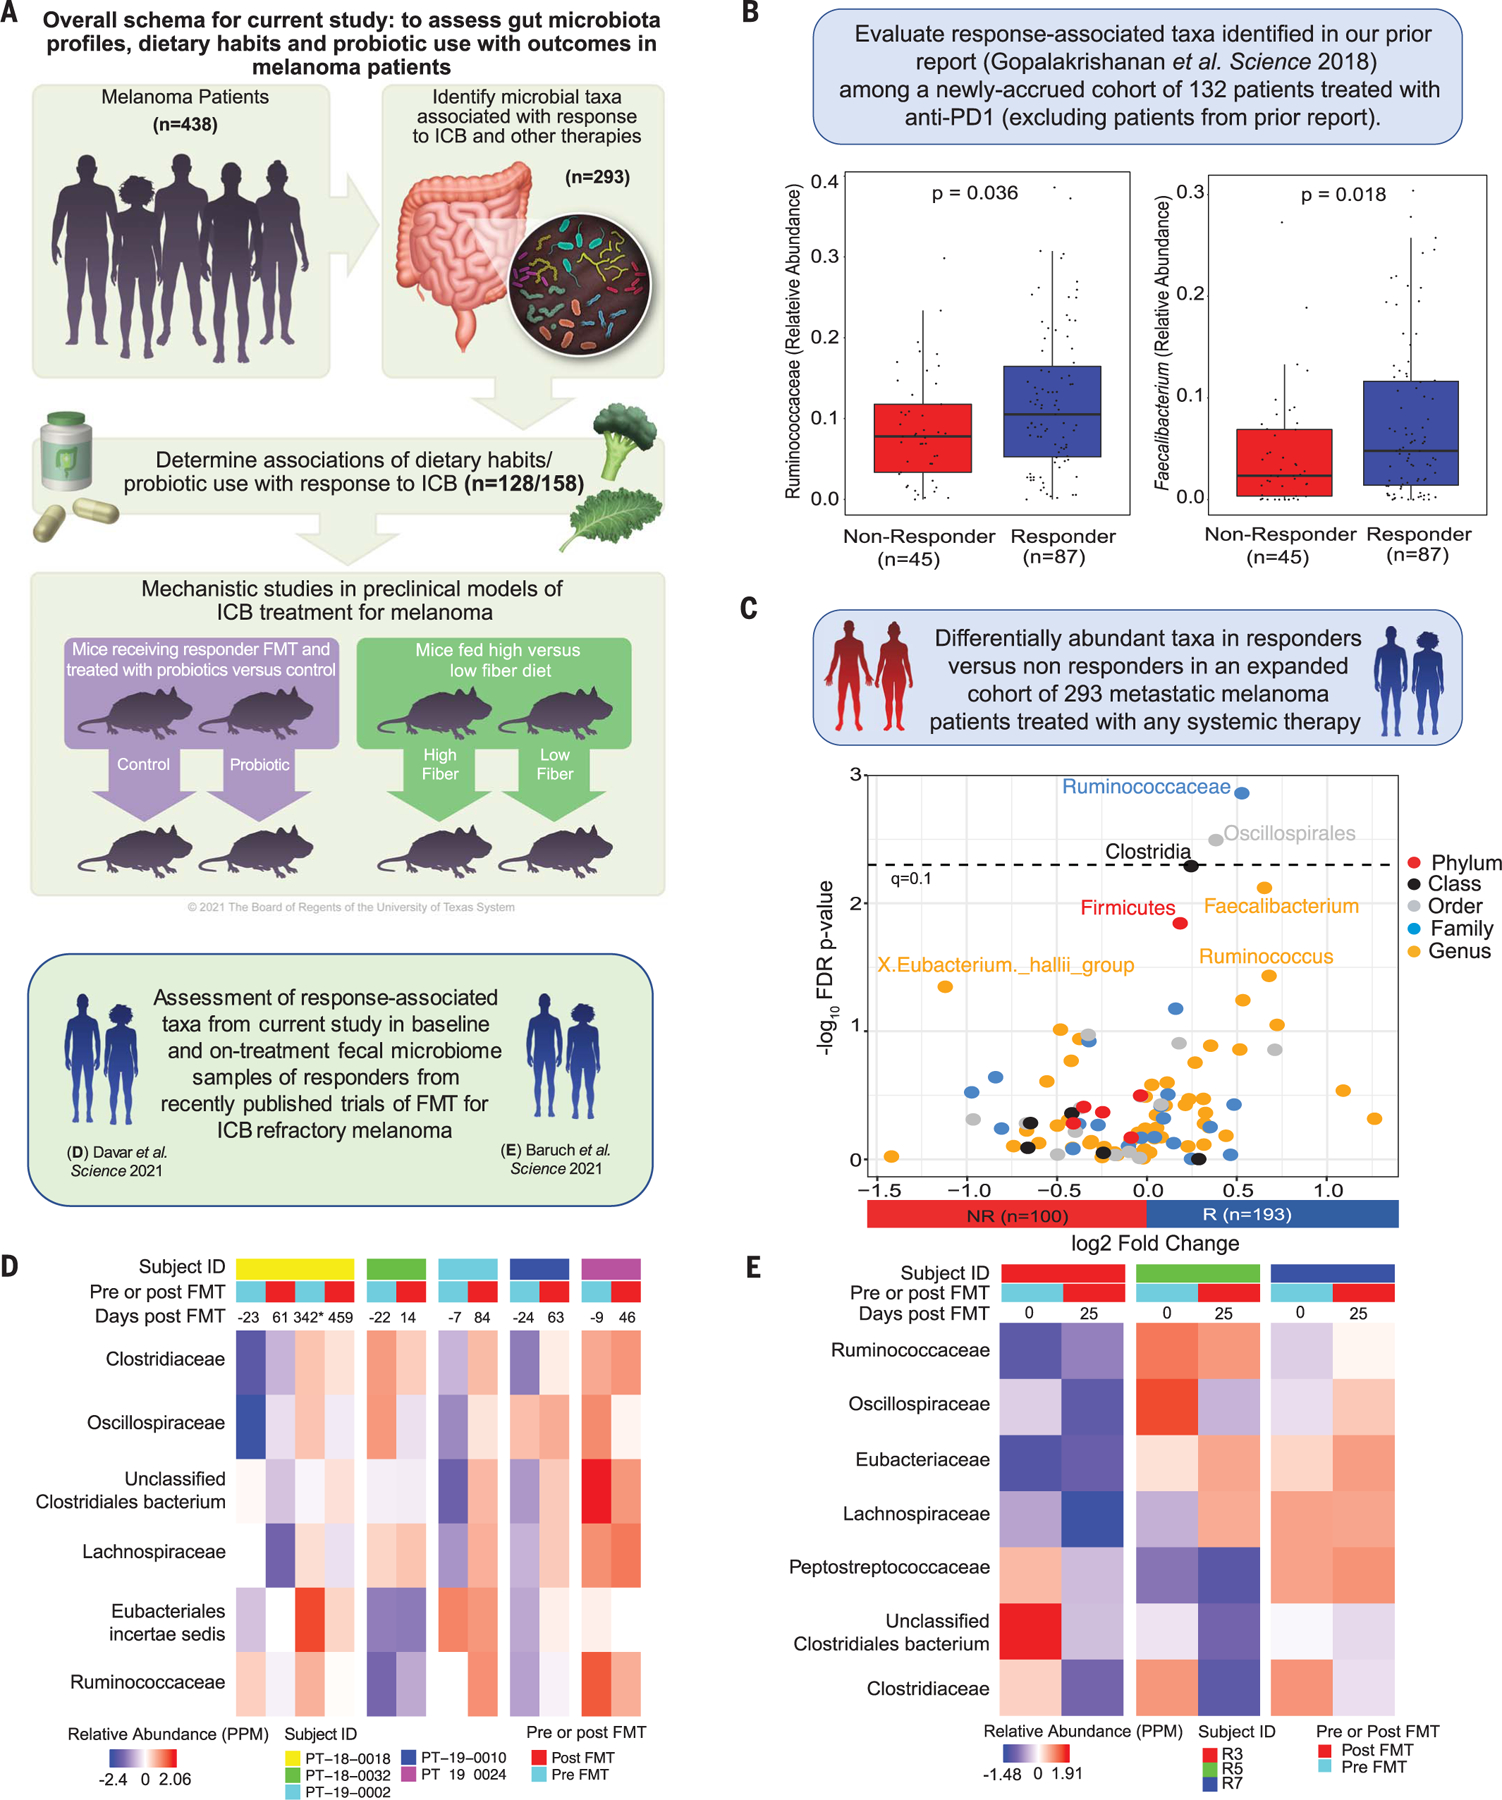
Fig. 1. Profiles of gut microbiota in patients with melanoma and associations with outcomes on therapy.

(A) Schema of study design. (B) Box plots comparing the relative abundance of anti–PD-1 response–associated taxa from Gopalakrishnan et al. (4) with a newly recruited cohort (n = 132) of anti–PD-1–treated patients (P = 0.036 and P = 0.018, respectively, for Ruminococcaceae and Faecalibacterium by Wilcoxon rank sum test). Patients included in the prior study were excluded from this analysis. (C) Volcano plot depicting pairwise comparisons of relative abundances of bacterial taxa. The y axis displays the −log10 false discovery rate (FDR)–corrected P value (dashed line, q < 0.1), and the x axis shows the log2 fold change comparing 193 R and 100 NR patients with systemic therapy across the full cohort, including patients from the prior study (by Wilcoxon rank sum test with FDR correction per level). (D) Heatmap of scaled relative abundances [parts per million (PPM)] of bacteria belonging to order Clostridiales and family Ruminococcaceae in pre- and post-FMT samples of anti–PD-1 refractory metastatic melanoma FMT recipients who responded to FMT + anti–PD-1 in Davar et al. (20) [National Center for Biotechnology Information (NCBI) accession no. PRJNA672867]. Number of days from FMT are depicted on the top of each heatmap column, with post-FMT values being the geometric mean days of all post-FMT time points for that patient. The geometric mean of relative abundances of post-FMT samples from each patient were calculated as the single post-FMT mean relative abundance. The exception is patient PT−18−0018, who received two FMTs (denoted by an asterisk). The first post-FMT column for this patient reflects the geometric mean of samples leading up to the second FMT event. (E) Heatmap of scaled relative abundances of bacteria belonging to order Clostridiales and family Ruminococcaceae in pre- and post-FMT samples of anti–PD-1 refractory metastatic melanoma FMT recipients who responded to FMT + anti–PD-1 in Baruch et al. (19) (NCBI accession no. PRJNA678737). Number of days from FMT are depicted on the top of each heatmap column, with post-FMT values being the geometric mean days of all post-FMT time points for that patient. The geometric mean of relative abundances of post-FMT samples from each patient were calculated as the single post-FMT mean relative abundance.
