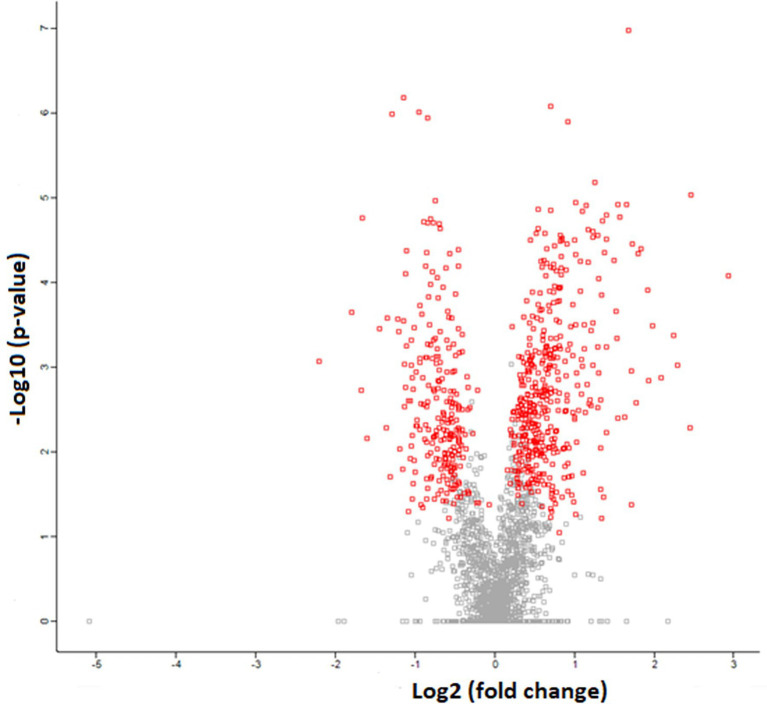
Figure 4.
Volcanic plot representation of Woody Breast and Normal sarcoplasmic reticulum proteome utilizing high-stringency criteria (FDR 0.05 and S0 factor 0.1) in which red dots correspond to significantly upregulated or downregulated proteins (p < 0.05). The gray dots represent proteins that are not different (p > 0.05).

