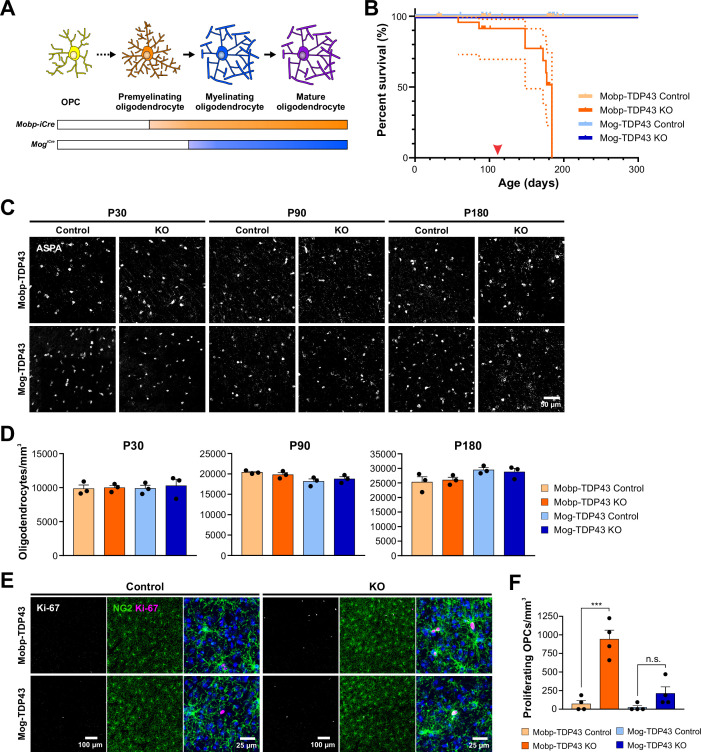
Figure 2. Early deletion of TDP-43 in premyelinating oligodendrocytes leads to seizure development, premature death, and increased oligodendrocyte turnover.
(A) Diagram of oligodendrocyte development showing Mobp-iCre induces Tardbp deletion at the premyelinating oligodendrocyte stage whereas Mog-iCre targets myelinating oligodendrocytes. (B) Kaplan–Meier survival curve for Mobp-TDP43 (orange) and Mog-TDP43 (blue) mouse lines. Dotted line indicates the 95% confidence interval. Log-rank (Mantel–Cox) statistical test showed significance at p value <0.0001 (n = 58, 33, 40, and 32). Red arrowhead points to ~P110 when the animals first exhibit spontaneous seizures. (C) ASPA+ oligodendrocyte staining in the motor cortex of Mobp-TDP43 and MOG-TDP43 mouse lines at P30, P90, and P180. (D) Quantification of ASPA+ oligodendrocyte density shows that there is no statistical difference between the samples at any given timepoint (one-way ANOVA with Tukey’s multiple comparisons test, n = 3, n.s. p value >0.05). (E) Immunostaining for Ki-67 and NG2 to identify proliferating oligodendrocyte precursor cells (OPCs) in Mobp-TDP43 and Mog-TDP43 at P90. (F) Quantification of Ki-67+NG2+ proliferating OPC density shows that it is statistically significantly increased in Mobp-TDP43 KO whereas Mog-TDP43 KO shows a trend toward an increased density (one-way ANOVA with Tukey’s multiple comparisons test, n = 4, ***p value <0.001, n.s. p value = 0.3776).

