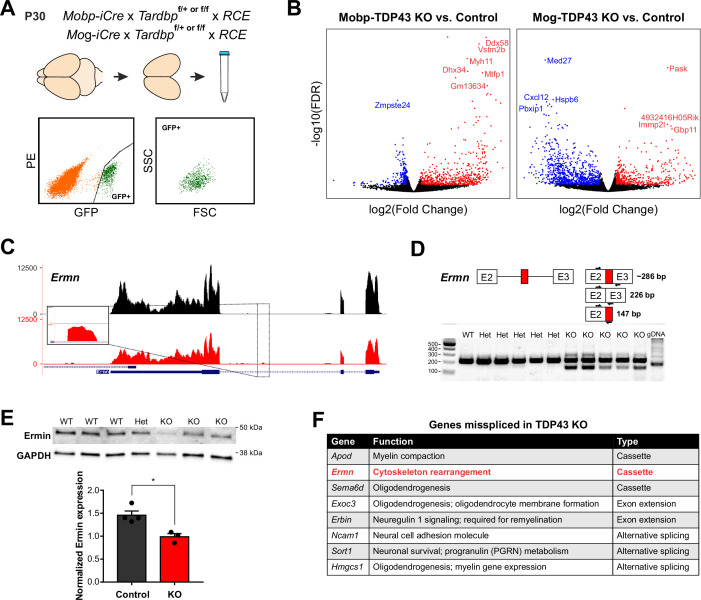
Figure 6. TDP-43 maintains oligodendrocyte transcriptional integrity by suppressing cryptic exon incorporation in key oligodendrocyte genes.
(A) Bulk RNA-Seq was performed with fluorescence-activated cell sorting (FACS)-isolated EGFP+ oligodendrocytes from P30 Mobp-TDP43-RCE and Mog-TDP43-RCE cortices. (B) Volcano plots comparing KO to Control in Mobp-TDP43 and Mog-TDP43 mouse lines showing statistically significantly differentially expressed genes (fold change >1, adjusted p value [false discovery rate, FDR] <0.05). Blue dots indicate downregulated genes whereas red dots indicate upregulated genes with TDP-43 KO. (C) Visualization of the cryptic exon located in Ermn. Gene annotation is shown on the bottom, labeling exons (thick) and introns (thin). Bulk RNA-Seq reads from Control and KO oligodendrocytes from both Mobp-TDP43 and Mog-TDP43 mouse lines are aligned to the mm10 genome. The cryptic exon in the intron 2 of Ermn is magnified to highlight the difference. (D) Reverse transcription-polymerase chain reaction (RT-PCR) validation of cryptic exon incorporation in Ermn in mouse whole brain tissue from Mog-TDP43 Control and KO. Three primers were used to identify (1) normal transcript (226 bp), (2) cryptic exon incorporated transcript (286 bp), and (3) the presence of cryptic exon (147 bp). Only the KO samples showed bands at 147 and 286 bp that represent cryptic exon incorporation into Ermn mRNA. (E) Western blotting assay to quantify the amount of Ermin protein in Mog-TDP43 Control and KO brains shows that Mog-TDP43 KO brains have a significantly decreased amount of Ermin protein (unpaired, two-tailed Student’s t-test, *p value = 0.0119, n = 4 and 3). (F) Table of genes that are misspliced in oligodendrocytes with loss of TDP-43. Cassette indicates incorporation of a nonconserved, novel cryptic exon whereas alternative splicing means usage of alternative, conserved exons. Exon extension indicates that the intronic sequence following an exon was incorporated into mature mRNA and became part of the exonic sequence.
Figure 6—figure supplement 1. The number of genes that are statistically significantly differentially expressed between different genotypes (false discovery rate FDR <0.05).
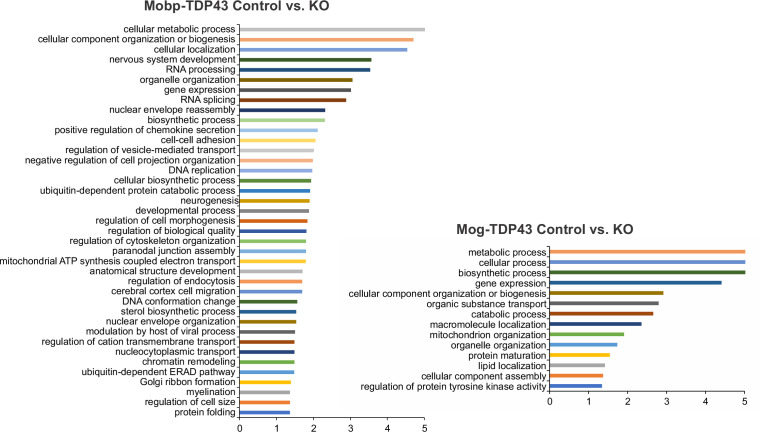
Figure 6—figure supplement 2. Gene ontology (GO) analysis from differentially expressed genes shows that Mobp-TDP43 KO and Mog-TDP43 KO show differential enrichment of biological processes.
Figure 6—figure supplement 3. Immunostaining for Ermin shows that KO oligodendrocytes have reduced cell body expression of Ermin protein compared to the Control.
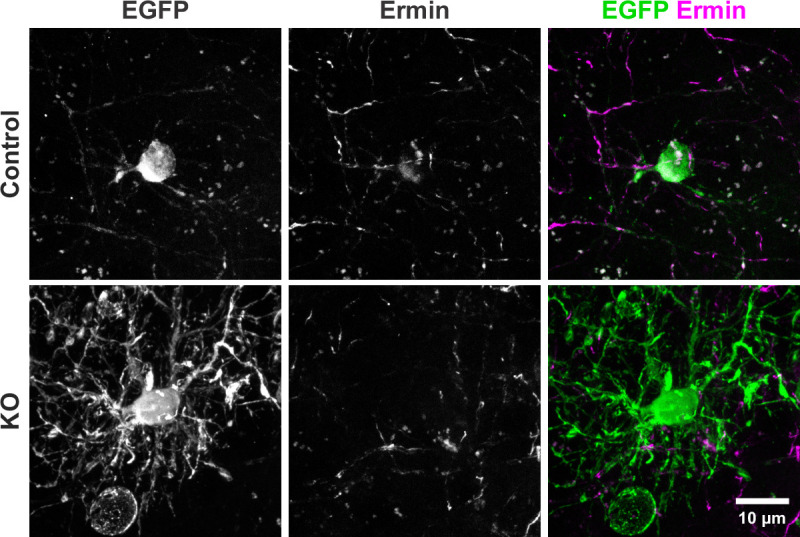
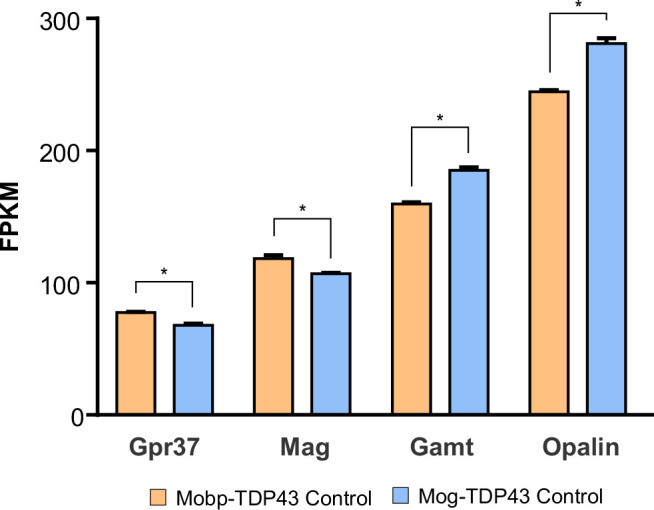
Figure 6—figure supplement 4. Fragments per kilobase of exon per million mapped fragments (FPKM) of Gpr37, Mag, Gamt, and Opalin in Mobp-TDP43 Control and Mog-TDP43 Control from bulk RNA-Seq in Figure 6.
