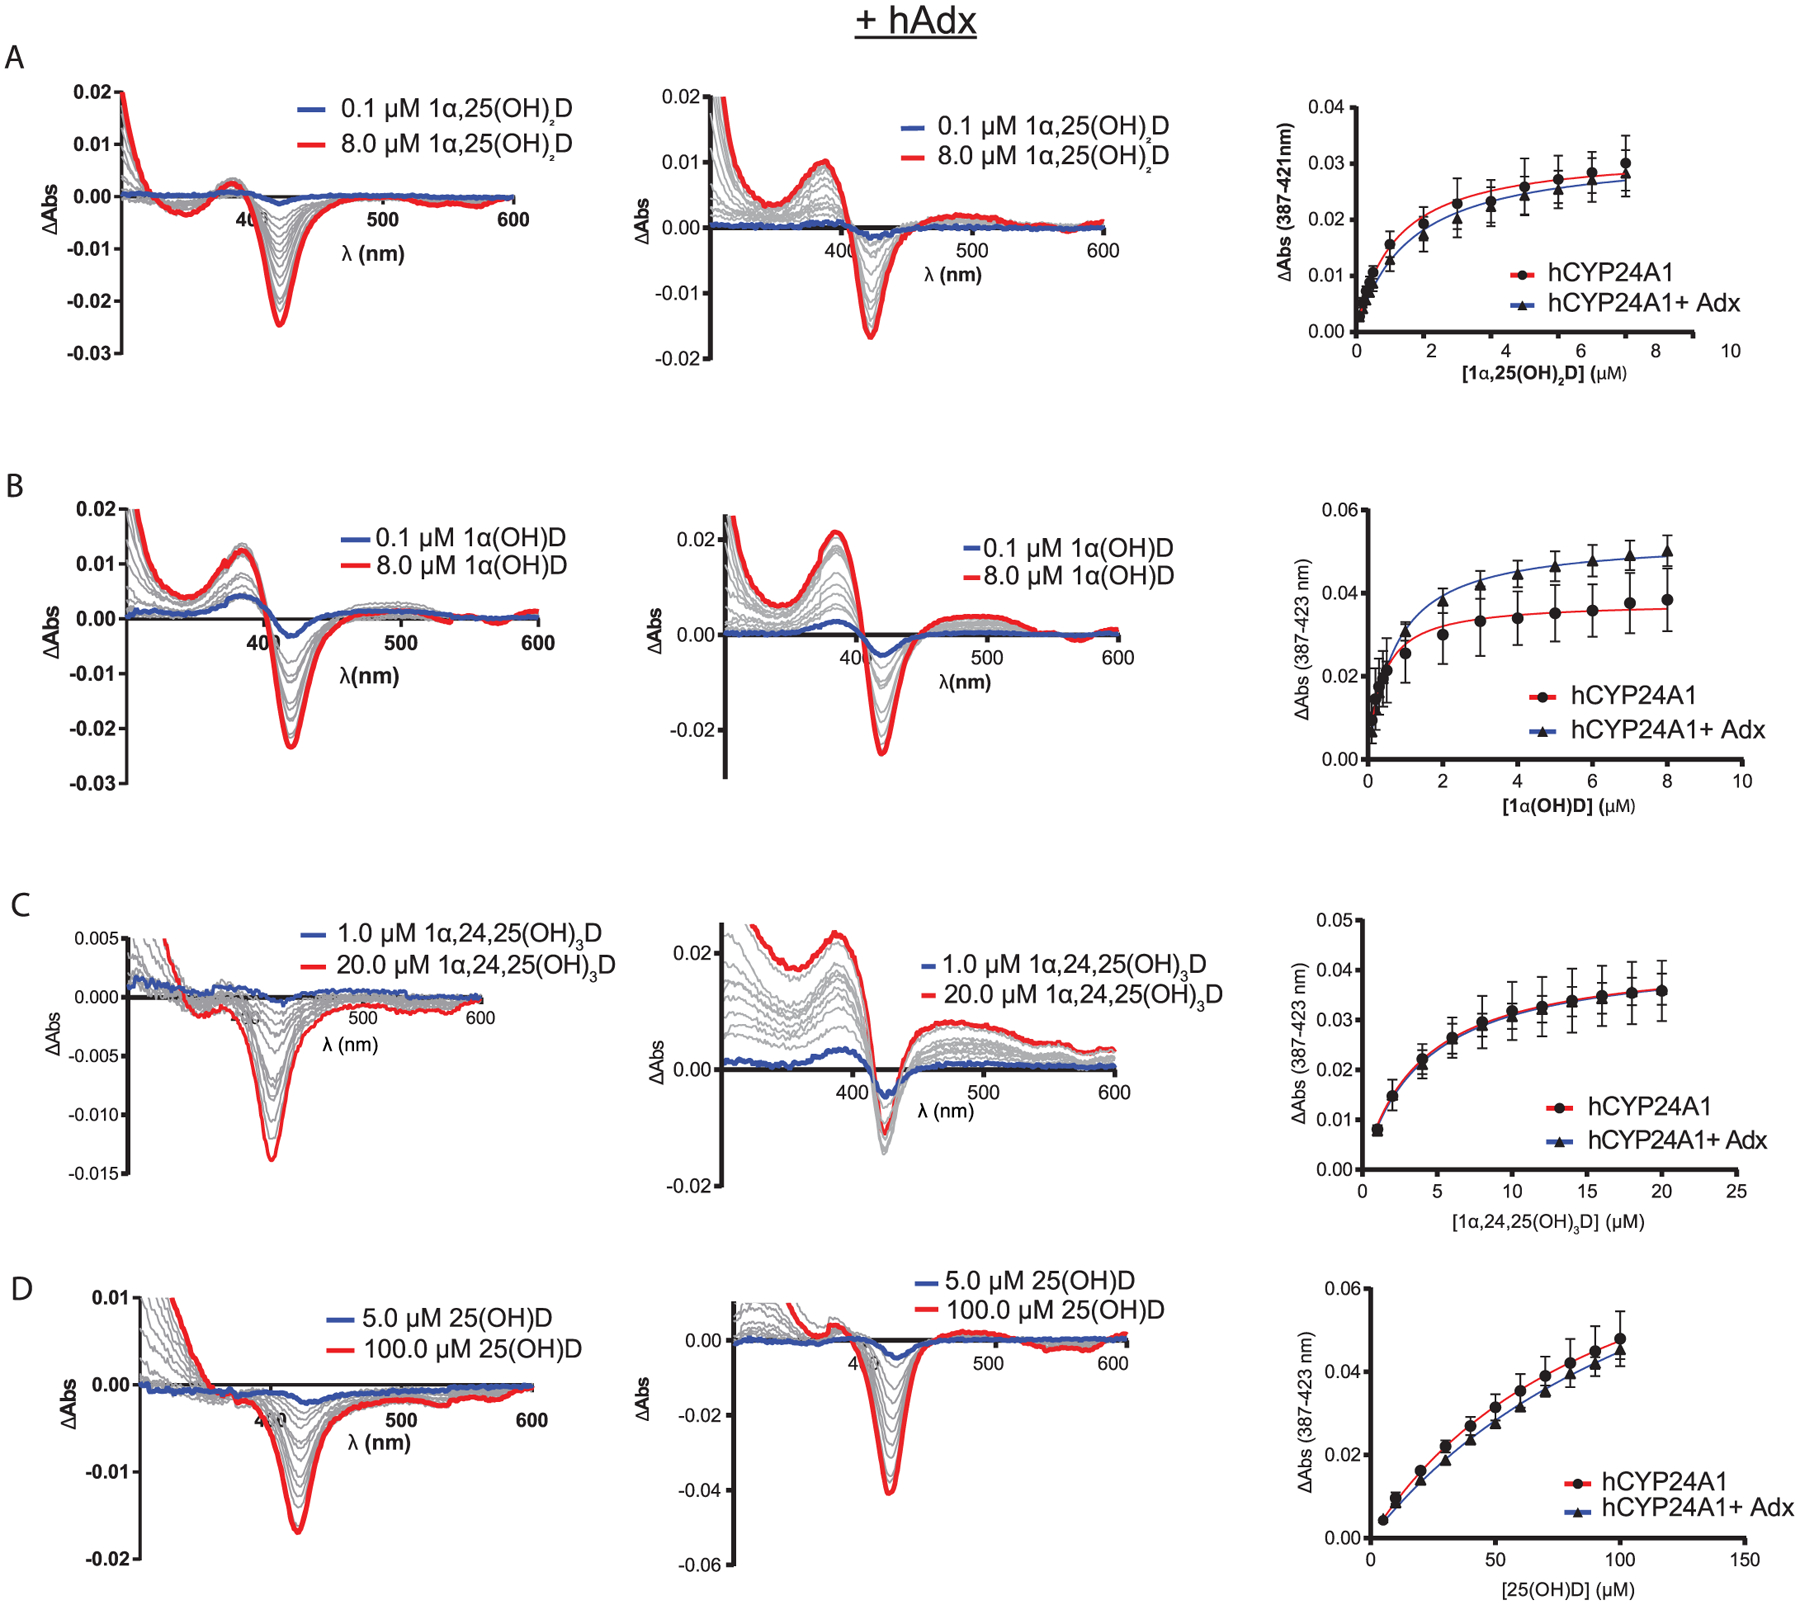
Figure 3.

(A–D) Ligands binding to hCYP24A1 with and without hAdx present. Difference spectra of ligands binding to hCYP24A1 (1 μM) (left-hand panels). Difference spectra of ligands binding to hCYP24A1 (1 μM) in the presence of hAdx (10 μM) (middle panels). The blue line is the initial titration point, and the red line is the final addition. Binding curves measuring ΔAbs between ~390 and ~420 nm are shown in the right-hand panels. Titrations were run in triplicate with error bars indicating one standard deviation.
