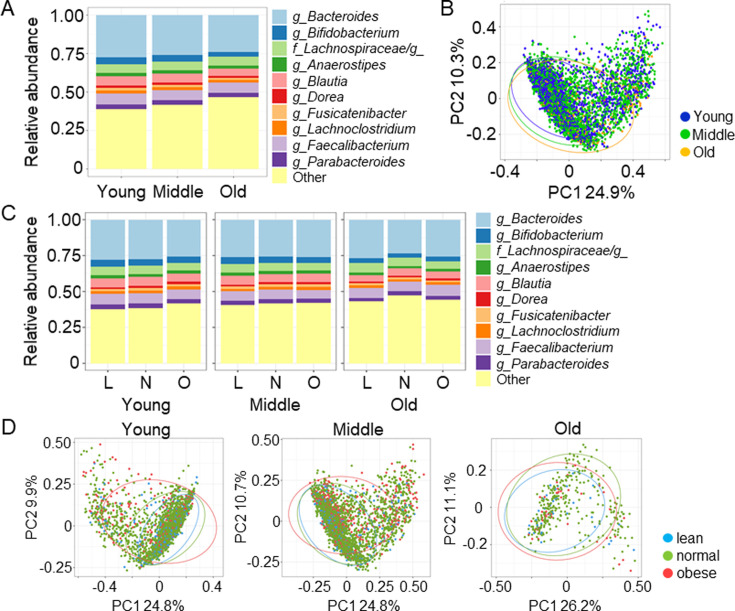
Fig. 3.
Gut microbiota at the genus level.
A. Distribution of gut microbiota at the genus level in the indicated groups. B. Principal coordinate analysis at the genus level was performed to compare the distribution of the gut microbiota. C. Distribution of gut microbiota at the genus level in the indicated groups. D. Principal coordinate analysis at the genus level in the indicated groups. L: lean; N: normal; O: obese.

