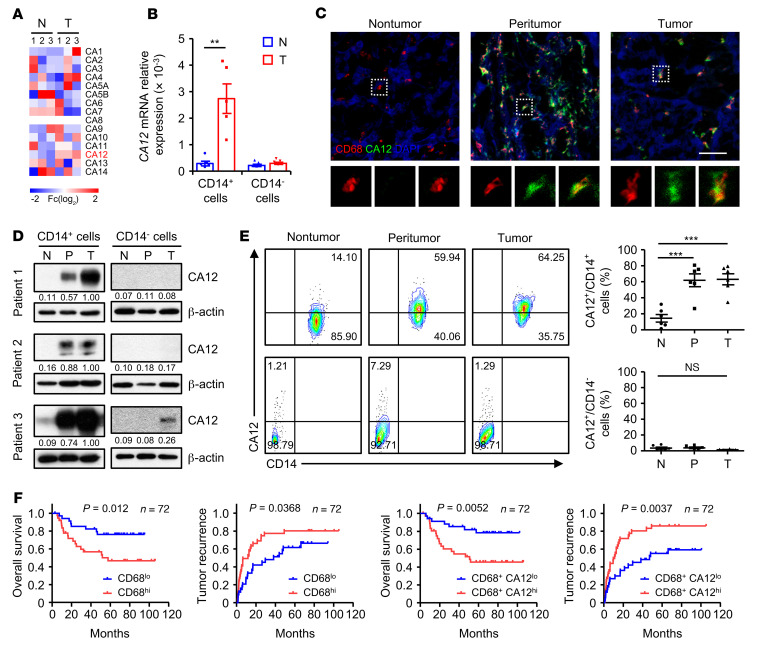
Figure 1. CA12 is selectively upregulated on tumor-infiltrating monocytes and macrophages and correlates with disease progression.
(A) CD14+ cells were purified from paired nontumor (N) and tumor tissues (T) from 3 patients with HCC. The levels of CD14+ cell αCA family gene expression were quantified by qPCR. (B) CD14+ and CD14– leukocytes were purified from paired nontumor and tumor tissues from HCC patients. Levels of CA12 expression in these cells were quantified by qPCR (n = 5). (C) Frozen sections of HCC samples were stained with an anti-human CD68 antibody (red), an anti-human CA12 antibody (green), and DAPI (blue). The colocalization and distribution of cell signals were analyzed by confocal microscopy. Scale bar: 50 μm. One out of five representative micrographs from 5 independent experiments is shown. (D) CD14+ and CD14– leukocytes were purified from paired nontumor, peritumor (P), and tumor tissues from HCC patients. The levels of CA12 expression in these cells were determined by immunoblotting (n = 3). (E) Fresh leukocytes were isolated from paired nontumor, peritumor, and tumor tissues from HCC patients. Levels of CA12 expression on CD14+ and CD14– leukocytes were determined by flow cytometry (n = 6). (F) Seventy-two HCC patients who underwent curative resection with follow-up data were divided into 2 groups according to the median value of CD68+ or CD68+CA12+ cell density in tumor tissues (CD68+ cells: low, ≤391 cells/mm2 [n = 35]; high, >391 cells/mm2 [n = 37]; CD68+CA12+ cells: low, ≤278 cells/mm2 [n = 35]; high, >278 cells/mm2 [n = 37]). The OS and TR of these patients were analyzed via the Kaplan-Meier method and log-rank test. Results shown in B and E are represented as mean ± SEM. P values were obtained by paired 2-tailed Student’s t test (B), 1-way ANOVA (E), or log-rank test (F). **P < 0.01; ***P < 0.001.

