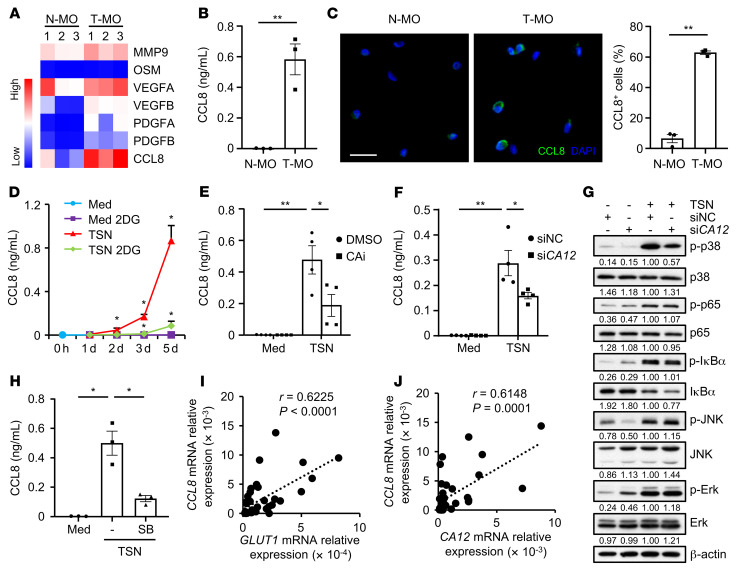
Figure 5. CA12 induces CCL8 production in tumor-associated monocytes and macrophages.
(A–C) CD14+ cells were purified from paired nontumor tissues (N-MO) and tumor tissues (T-MO) from 3 patients with HCC. Expression levels of metastasis-related genes were quantified by qPCR (A). Levels of CCL8 production by these cells were determined by ELISA (B) and confocal microscopy (C) (CCL8: green; DAPI: blue). Scale bar: 20 μm. (D–H) CD14+ cells were purified from the peripheral blood of healthy donors. (D) Cells were left untreated or treated with HepG2 TSN in the presence or absence of 2DG for the indicated times, and CCL8 production was measured by ELISA (n = 3). (E) Cells were left untreated or treated with HepG2 TSN in the presence or absence of CAi (100 μM) for 72 hours, and CCL8 production was measured by ELISA (n = 4). (F and G) Cells were transfected with siNC or siCA12 and then left untreated or treated with HepG2 TSN for 72 hours. Levels of CCL8 production were measured by ELISA (F) (n = 4). Expression levels of p-p38, p38, p-p65, p65, p-IκBα, IκBα, p-JNK, JNK, p-Erk, and Erk were determined by immunoblotting (G) (n = 5). (H) Cells were left untreated or treated with HepG2 TSN in the presence or absence of SB202190 (SB) (25 μM) for 72 hours, and CCL8 production was measured by ELISA (n = 3). (I and J) CD14+ cells were purified from tumor tissues from 36 patients with HCC. Correlations between the mRNA levels of CCL8 and GLUT1 or CA12 in the cells were analyzed by qPCR. Results shown in B–F and H are represented as mean ± SEM. P values were obtained by 2-tailed Student’s t test (B and C), 2-way ANOVA (D–F and H), or Pearson’s correlation and linear regression analysis (I and J). *P < 0.05; **P < 0.01.

