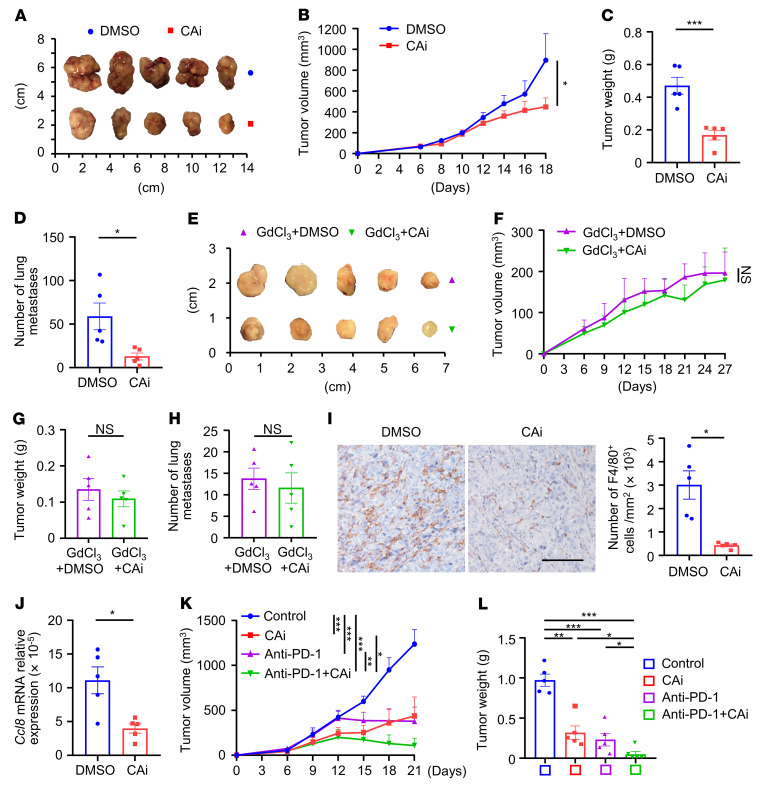
Figure 7. Blockade of CA12 reduces macrophage infiltration and induces tumor regression in mice in vivo.
(A–C) C57BL/6J mice were s.c. injected with Hepa1-6 cells, DMSO or CAi was then i.p. administered. Tumors were excised and photographed (A), tumor volumes (B) and weights (C) were measured. (D) An orthotopic tumor model was established by intrahepatic injection of Hepa1-6 cells, DMSO or CAi was then i.p. administered. Lungs were excised from mice, and tumor lung metastases were counted. (E–G) Mice bearing with subcutaneous tumors were i.p. injected with GdCl3 and DMSO or Cai. Tumors were excised and photographed (E), tumor volumes (F) and weights (G) were measured. (H–J) Mice bearing orthotopic Hepa1-6 tumors were i.p. injected with (H) or without (I and J) GdCl3, and treated with DMSO or CAi. Lungs were excised from mice, and tumor lung metastases were counted (H). Paraffin-embedded sections of orthotopic hepatic tumors were stained with anti-mouse F4/80 antibody, and infiltration of F4/80+ cells was analyzed, scale bar: 500 μm (I). CD11b+Ly6G– cells were isolated from orthotopic hepatic tumors by FACS, and Ccl8 expression in these cells were quantified by qPCR (J). (K and L) Mice bearing with subcutaneous tumors were i.p. injected with DMSO together with control IgG (designated as control), CAi, anti-mouse PD-1 antibody, or CAi in combination with the anti-mouse PD-1 antibody. Tumor volumes (K) and weights (L) were measured. There were 5 representatives for each group in A–L. Results shown in B–D and F–L are represented as mean ± SEM. P values were obtained by 2-way ANOVA with Tukey’s correction t test (B, F, and K), 2-tailed Student’s t test (C, D, and G–J), or 1-way ANOVA (L). *P < 0.05; **P < 0.01; ***P < 0.001.

