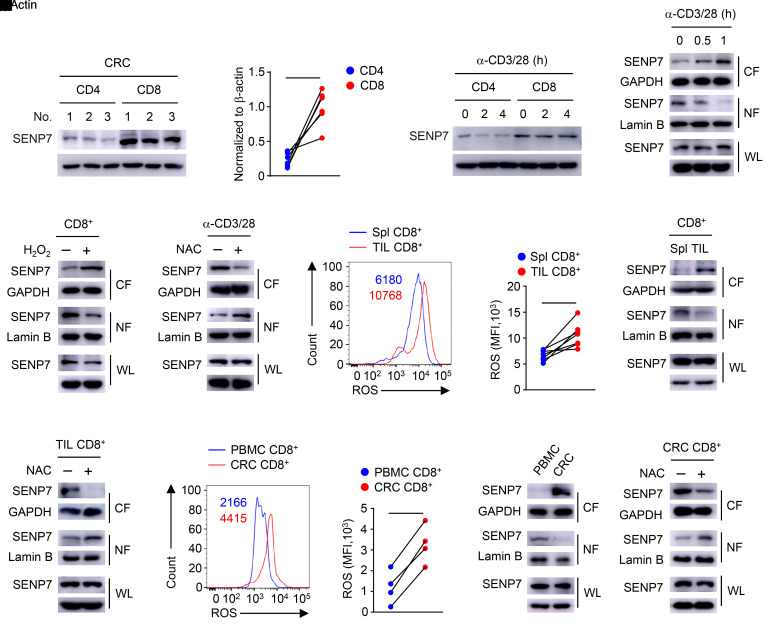
Figure 1. ROS trigger cytosolic translocation of SENP7 in tumor-infiltrating CD8+ T cells.
(A and B) Immunoblot analysis of the indicated proteins (A) and quantification of SENP7 expression (B, n = 6) in CD4+ and CD8+ T cells from CRC tissues. (C) Immunoblot analysis of the indicated proteins in CD4+ and CD8+ T cells from WT mice stimulated with anti-CD3 and anti-CD28 antibodies (α-CD3/28). (D–F) Immunoblot analysis using whole-cell lysates (WL) and nuclear (NF) and cytoplasmic (CF) fractions of CD8+ T cells from WT mice stimulated with anti-CD3 and anti-CD28 antibodies (D), CD8+ T cells from WT mice treated with 0.2 mM H2O2 for 1 hour (E), and CD8+ T cells from WT mice stimulated with anti-CD3 and anti-CD28 antibodies plus 10 mM NAC for 1 hour (F). (G and H) Histogram shows the MFI of ROS (G) and quantification of the MFI of ROS (H, n = 7) in CD8+ T cells from the spleens (Spl) and tumors (TIL) of tumor-bearing mice (day 7 after injection of tumors with MC38 cells). (I and J) Immunoblot analysis using CD8+ T cells from the spleens and tumors of tumor-bearing mice (I) and tumor-infiltrating CD8+ T cells treated with 10 mM NAC for 1 hour (J). (K and L) Histogram shows the MFI of ROS (K) and quantification of the MFI of ROS (L, n = 4) in CD8+ T cells from patient-derived PBMCs and CRC tissues. (M and N) Immunoblot analysis of the indicated proteins in CD8+ T cells from patient-derived PBMCs and CRC tissues (M) and CD8+ T cells from CRC tissues treated with 10 mM NAC for 1 hour (N). Representative data are shown from 2 (A, M, and N) and 3 (C–F, I, and J) independent experiments. *P < 0.05 and **P < 0.01, by Student’s t test (B, H and L).

