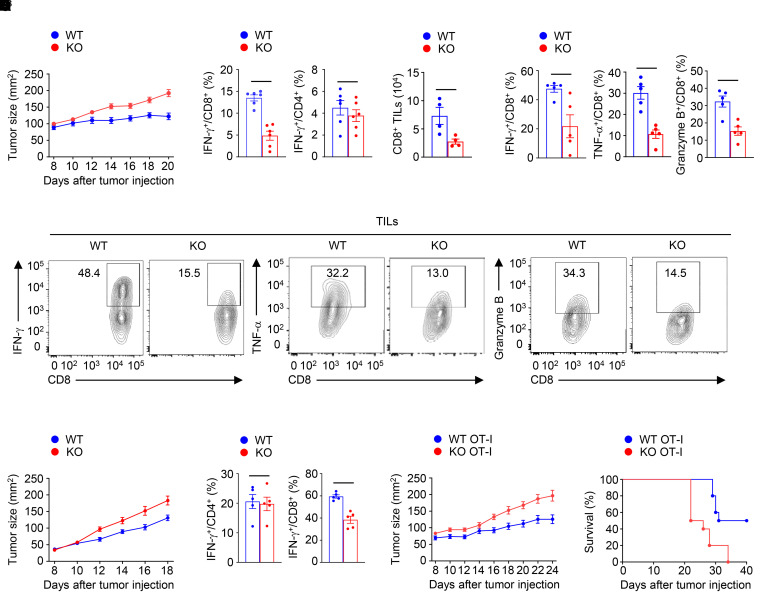
Figure 2. SENP7 ablation dampens CD8+ T cell antitumor responses in vivo.
(A) Tumor growth in Senp7fl/fl (WT) and Senp7fl/fl Cd4-Cre (KO) mice injected s.c. with MC38 murine colon cancer cells (n = 10 mice per group). (B) Flow cytometric analysis of the frequency of IFN-γ–producing CD8+ or CD4+ T cells in the draining lymph nodes of WT and KO mice injected s.c. with MC38 murine colon cancer cells (day 14, n = 6). (C) CD8+ T cell numbers in tumors (TILs) of WT and KO mice injected s.c. with MC38 murine colon cancer cells (day 14, n = 4) were normalized to 100 mg tumor tissue. (D and E) Flow cytometric analysis of IFN-γ–producing, TNF-α–producing, or granzyme B–producing CD8+ T cells in the tumors of WT and KO mice injected s.c. with MC38 murine colon cancer cells (day 14, n = 5). The data are presented as summary graphs in D and as representative plots in E. (F) Tumor growth in WT and KO mice injected s.c. with B16-F10 melanoma cells (n = 10 mice per group). (G) Frequency of IFN-γ–producing CD4+ T cells or CD8+ T cells in the tumors of WT and KO mice injected s.c. with B16-F10 melanoma cells (day 14, n = 5). (H and I) Tumor growth and survival curves for B6.SJL mice injected s.c. with MC38-OVA cancer cells adoptively transferred with WT OT-I or Senp7fl/fl Cd4-Cre (KO) OT-I CD8+ T cells on day 7 after tumor cell inoculation (n = 10 mice per group). Representative data are shown from 3 independent experiments. Data are presented as the mean ± SEM. *P < 0.05 and **P < 0.01, by 2-tailed Student’s t test (A–D and F–H) and log-rank (Mantel-Cox) test (I).

