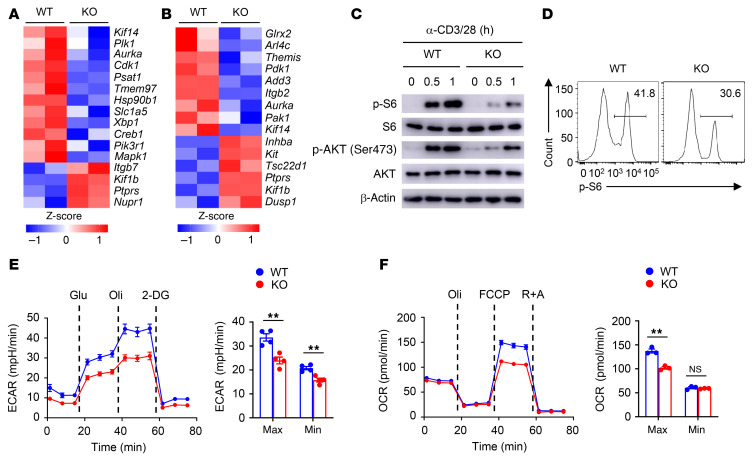
Figure 4. SENP7 promotes glycolysis and OXPHOS of CD8+ T cells.
(A) RNA-Seq analysis using WT and KO CD8+ T cells isolated from the tumors of mice injected s.c. with MC38 colon cancer cells (day 7 after injection). Heatmap shows PI3K/mTOR signaling pathway–related genes. (B) RNA-Seq analysis using naive WT and KO CD8+ T cells stimulated with anti-CD3 and anti-CD28 antibodies for 8 hours. Heatmap shows PI3K/mTOR signaling pathway–related genes. (C) Immunoblot analysis of the indicated proteins in WT and KO CD8+ T cells stimulated with anti-CD3 and anti-CD28 antibodies for the indicated durations. (D) Flow cytometric analysis of p-S6 expression in WT and KO CD8+ T cells stimulated with anti-CD3 and anti-CD28 antibodies for 2 hours. (E) ECAR of WT and KO naive CD8+ T cells stimulated for 6 hours with antibodies against CD3 and CD28 under minimum (Min) or maximum (Max) conditions with the addition of different reagents (n = 4). (F) OCR of WT and KO naive CD8+ T cells stimulated for 6 hours with antibodies against CD3 and CD28 under minimum or maximum conditions with the addition of different reagents (n = 3). Data are representative of 3 independent experiments and are presented as the mean ± SEM. **P < 0.01, by Student’s t test. Glu, glucose; Oli, oligomycin; R+A, rotenone/antimycin A.

