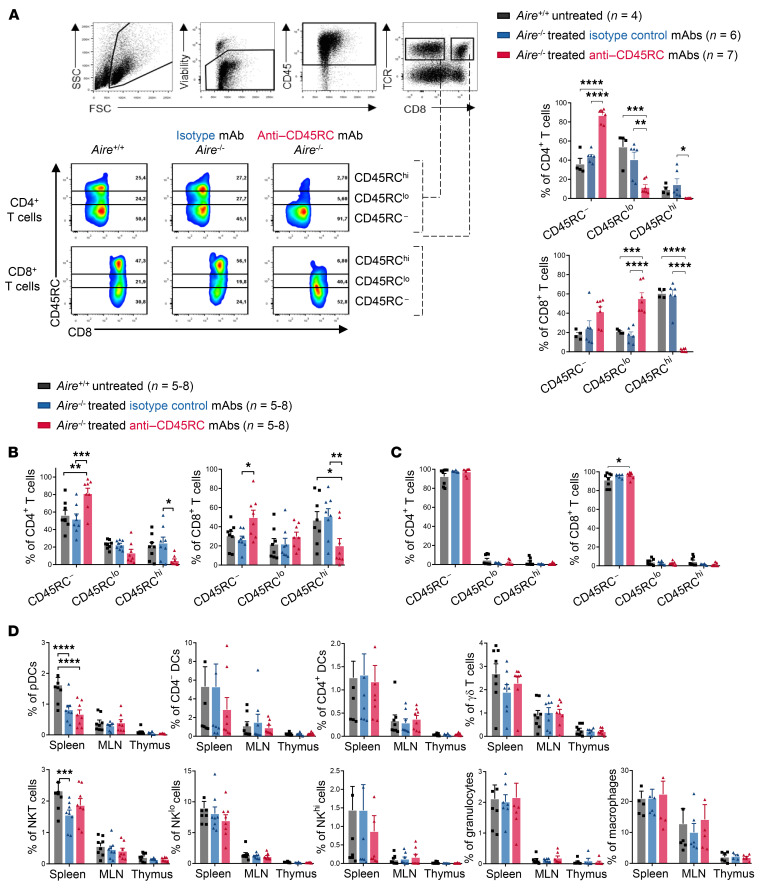
Figure 3. Anti-CD45RC mAb specifically depletes CD45RChi Tconv cells and increases CD45RClo/– Tregs.
(A–C) Blood at 2 weeks of treatment (A) and spleen (B) and thymus (C) at 4 months of treatment of Aire–/– rats with isotype control or anti-CD45RC mAbs were stained for the expression of CD45RC on CD8+ and CD4+ T cells by flow cytometry and compared with those from Aire+/+ rats. (A) Shown is a representative staining of 4–7 animals. The gates indicate the high, low, and negative subsets of CD45RC. Mean ± SEM of CD45RC expression on CD4+ and CD8+ T cells after 2 weeks of treatment is summarized in the graphs on the right. ANOVA: *P < 0.05, **P < 0.01, ***P < 0.001, ****P < 0.0001. (B and C) Results are shown as mean ± SEM of CD45RC subsets among CD4+ T cells (left) or CD8+ T cells (right). ANOVA: *P < 0.05, **P < 0.01, ***P < 0.001. (D) Cell subset distribution was analyzed by flow cytometry among immune cells from spleen, mesenteric lymph nodes (MLN), and thymus of untreated Aire+/+ and isotype control or anti-CD45RC mAb–treated Aire–/– rats at the time of sacrifice. Results are shown as mean ± SEM. ANOVA: ***P < 0.001, ****P < 0.0001.

