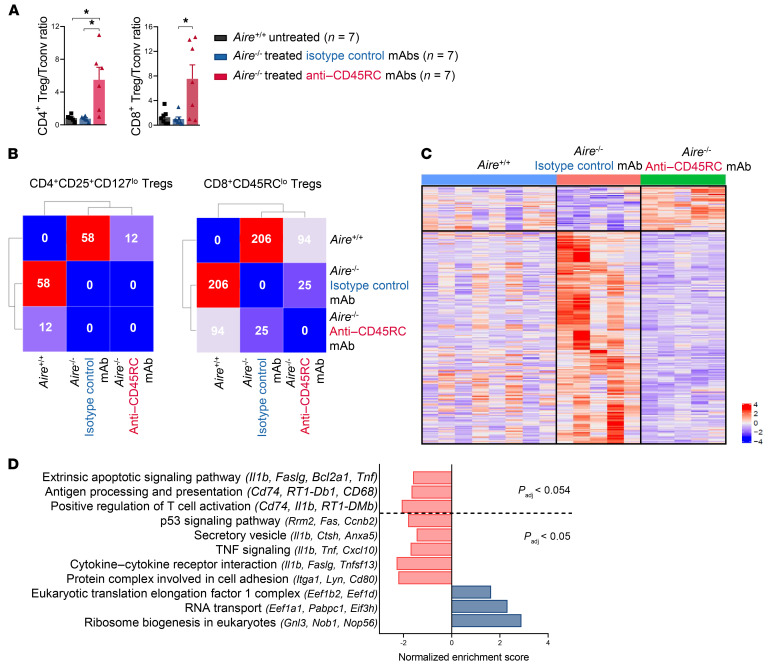
Figure 5. Anti-CD45RC treatment switches the Treg/Tconv balance and restores the altered transcriptomic profile of Tregs in Aire–/– rats.
(A) Ratio of CD4+CD25+CD127lo/– or CD8+CD45RClo/– Tregs versus CD45RChi Tconv cells in Aire–/– rats treated with isotype control (n = 7) versus anti-CD45RC mAb (n = 7). ANOVA: *P < 0.05. (B) Matrix showing the number of genes differentially expressed between CD4+ (left panel) and CD8+ (right panel) Tregs from the following groups: WT rats (n = 8) and Aire–/– rats treated with the isotype control (n = 5) or the anti-CD45RC mAb (n = 5). (C) DGE RNA sequencing heatmap analysis of CD8+CD45RClo Tregs showing the relative expression of genes. Columns correspond to samples, and rows correspond to differentially expressed genes. Expression values were averaged per sample and scaled per gene. Blue represents lowly-expressed genes and red represents highly expressed genes. (D) Normalized enrichment score of biological pathways upregulated or downregulated in Aire–/– rats treated with the anti-CD45RC mAb (n = 5) compared with Aire–/– rats treated with the isotype control mAb (n = 5).

