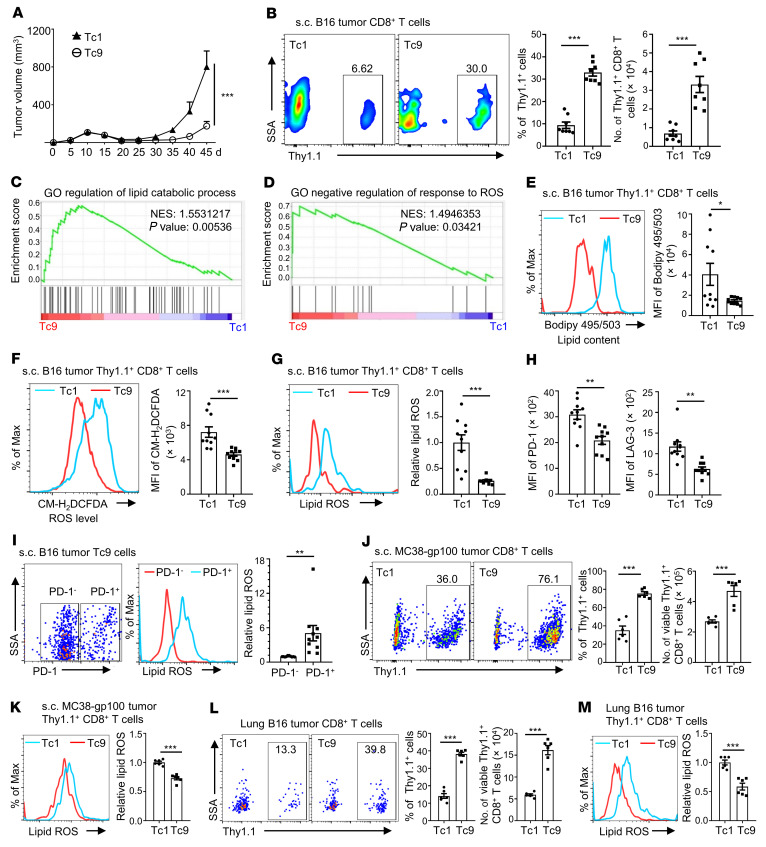
Figure 1. Persistence of adoptively transferred CD8+ T cells in the TME is negatively correlated with their lipid peroxidation.
(A and B) Thy1.1+ Pmel-1 Tc1 or Tc9 cells were i.v. injected into Thy1.2+ B6 mice bearing 10-day s.c. B16 tumors with adjuvant treatments (CTX, dendritic cells, and rhIL-2). Tumor growth curve (n = 5), Thy1.1+ percentages in CD8+ T cells, and Thy1.1+ CD8+ T cell numbers in tumors on day 45 after tumor injection (n = 8). (C and D) GSEA of indicated gene sets on day 24 after tumor injection. GO, Gene Ontology; NES, normalized enrichment score. (E) Lipid content (BODIPY 495/503 staining), (F) total ROS level (CM-H2DCFDA staining), (G) lipid ROS, and (H) PD-1 and LAG-3 expression of transferred Tc1 and Tc9 cells on day 45 after tumor injection (n = 10, two pooled independent experiments). (I) Tumor-infiltrating Tc9 cells were divided into PD-1+ and PD-1– groups and analyzed for the level of lipid ROS (n = 10). (J and K) Thy1.1+ Pmel-1 Tc1 or Tc9 cells were i.v. injected into Thy1.2+ B6 mice bearing 10-day MC38-gp100 tumors with adjuvant treatments. Shown are Thy1.1+ percentages in CD8+ T cells, Thy1.1+ CD8+ T cell numbers, and relative lipid ROS levels of Tc1 and Tc9 cells in tumors on day 40 after tumor injection (n = 6). (L and M) Thy1.1+ Pmel-1 Tc1 or Tc9 cells were i.v. injected into Thy1.2+ B6 mice bearing 12-day lung metastatic B16 tumors. Shown are Thy1.1+ percentages in CD8+ T cells, Thy1.1+ CD8+ T cell numbers, and relative lipid ROS levels of Tc1 and Tc9 cells in tumors on day 17 after tumor injection (n = 6). Data are presented as mean ± SEM. Tumor-infiltrating Thy1.1+ CD8+ T cell number was normalized to 100 mg tumor tissue. *P < 0.05; **P < 0.01; ***P < 0.001 by 2-way ANOVA in A and unpaired, 2-tailed Student’s t test in the other panels.

