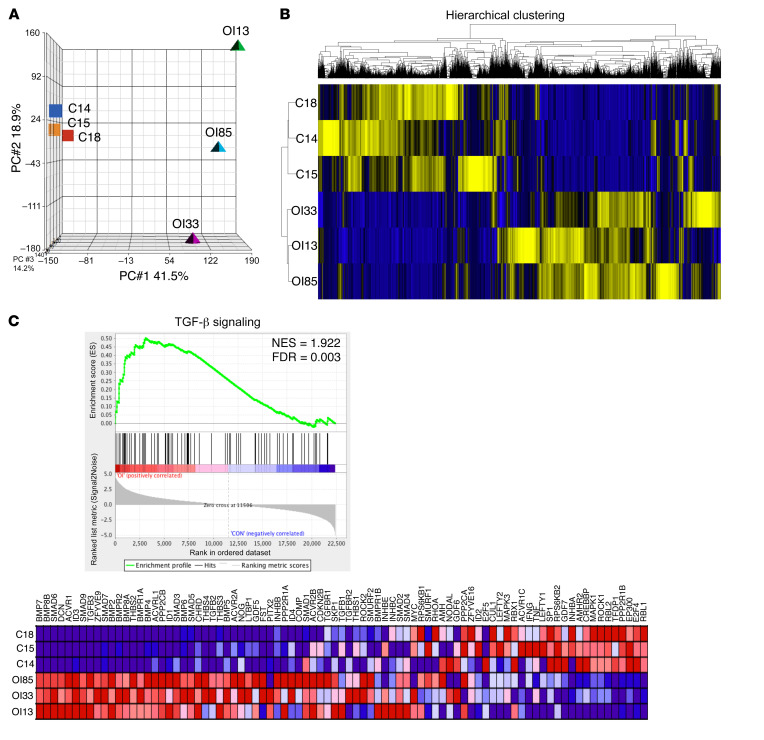
Figure 1. Transcriptomic and bioinformatics analyses demonstrate activation of TGF-β signaling in OI type III bone.
(A) Principal component analysis (PCA) plot of transcriptomic data from non-OI and OI type III bones in 3 principal component dimensions. (B) Hierarchical clustering based on Euclidian distance using RPKM of all non-OI and OI type III bone data. Blue, downregulated; yellow, upregulated. (C) Gene set enrichment plot demonstrated activation of TGF-β signaling. C18, C14, and C15 represent 3 biologically distinct non-OI bone samples. OI85, OI33, and OI31 represent 3 biologically distinct OI type III bone samples. The expression pattern of genes involved in the TGF-β gene set in the analysis database is shown. NES, normalized enrichment score; FDR, false discovery rate. Blue, downregulated; red, upregulated.

