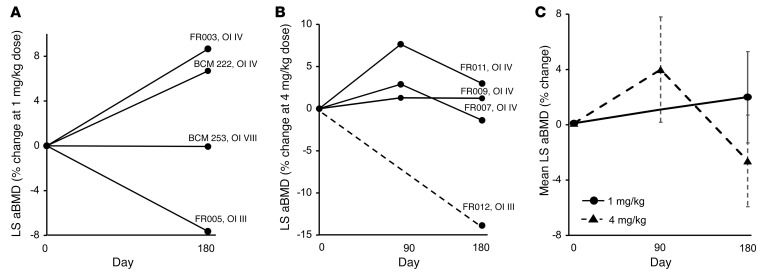
Figure 4. Effect of fresolimumab on LS aBMD.
The percentage change in LS aBMD in (A) the 1 mg/kg dose cohort (n = 4) and (B) the 4 mg/kg dose cohort (n = 4). (C) Average aBMD changes at each time point based on dose. In B, aBMD could not be assessed in FR012 at the 90-day time point; therefore, the result is shown as a dotted line. In C, the solid lines represent results for the 1 mg/kg dose cohort, and the dotted lines represent results for the 4 mg/kg dose cohort. Data are shown as the mean ± SEM.

