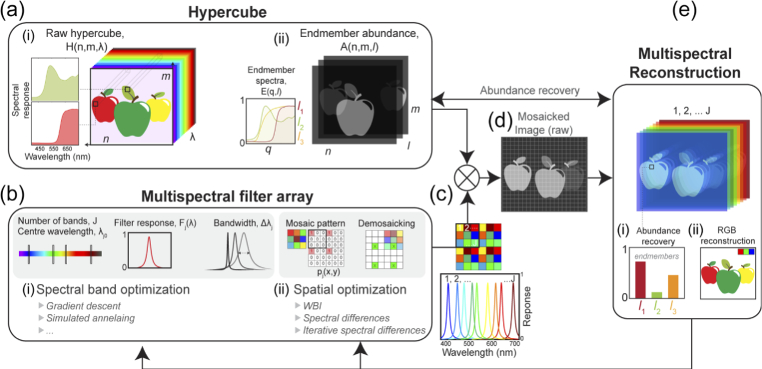
Fig. 1.
Multispectral Filter Array Optimisation (Opti-MSFA) flowchart and operating overview. (a) Input hypercube datasets; supplied format either (i) raw data or (ii) as an abundance map with endmember abundances. (b) Simulation of MSFA with input parameters through spectral channel (i) and spatial (ii) optimization. (c) The simulated MSFA design for each iteration is multiplied by the input hypercube which generates the raw mosaicked dataset (d). The multispectral image is reconstructed (e) along with endmember abundance (i) and RGB image (ii).

