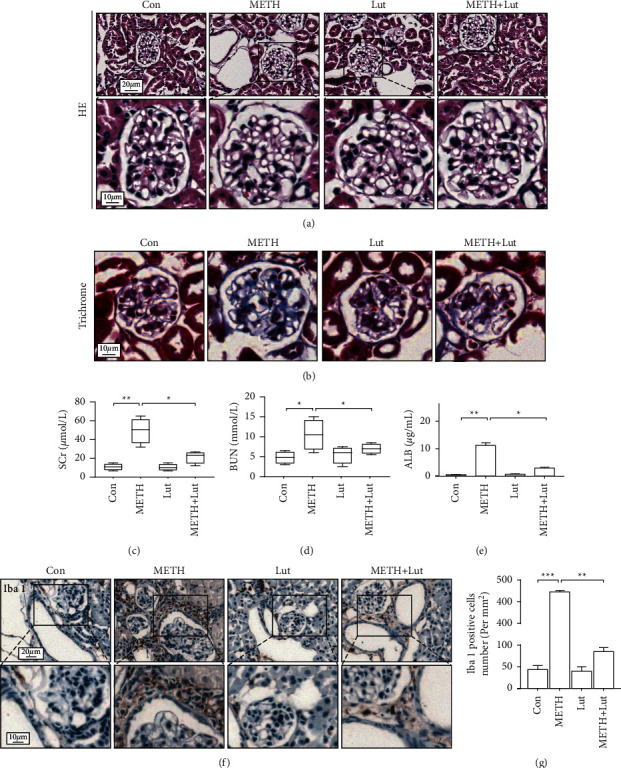
Figure 1.

Glomerular pathology after chronic methamphetamine exposure in each group. (a) Representative images of H&E staining of mouse kidneys. (b) Representative images of Masson's trichrome staining of mouse kidneys. (c) SCr level in each group mice. (d) BUN level in each group mice. (e) Urine albumin level in each group mice. (f) Immunohistochemistry staining of Iba-1 in mouse kidneys. (g) Analysis of number of Iba-1 positive cells in each group; ∗p < 0.05, ∗∗p < 0.01, and ∗∗∗p < 0.001 by one-way ANOVA and Bonferroni post hoc analyses. n = 6 per group.
