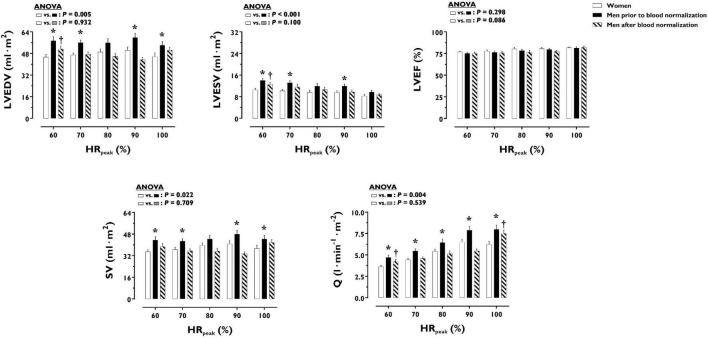
FIGURE 1.
Left ventricular volumes and function during incremental exercise in women and men prior to and after blood normalization. *P < 0.05 between women and men prior to blood normalization. †P < 0.05 between women and men after blood normalization. Data are expressed as mean ± SEM. Number of biological observations for each graph: LVEDV (n = 195), LVESV (n = 195), LVEF (n = 195), SV (n = 195), Q (n = 195). Echocardiographic data were analyzed within ± 5 bmp of specific percentages of HRpeak. HRpeak, peak heart rate; LVEDV, left ventricular end-diastolic volume; LVEF, left ventricular ejection fraction; LVESV, left ventricular end-systolic volume; Q, cardiac output; SV, stroke volume.

