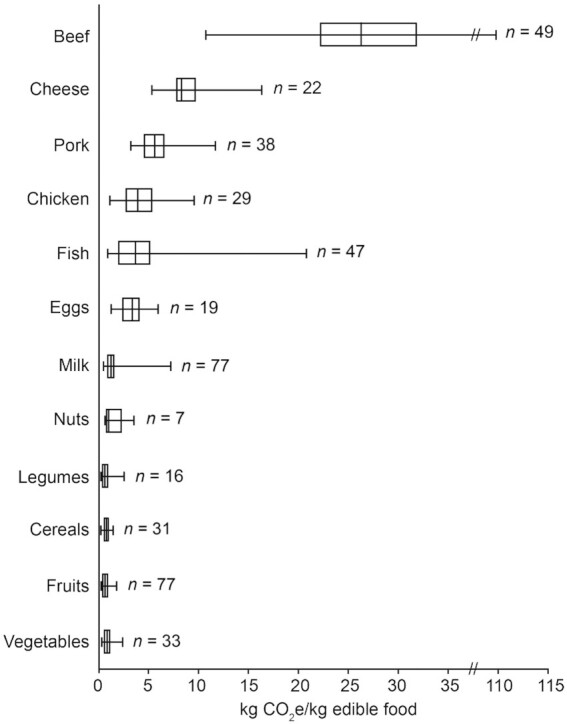
FIGURE 1.

Greenhouse gas emissions in the production of foods. Values shown in the boxplots are minimum and maximum values, IQRs (rectangle borders), and medians (line inside the rectangle). CO2e, CO2 equivalents; n, number of studies included. Reproduced with permission from reference 156; adapted from reference 155 with permission.
