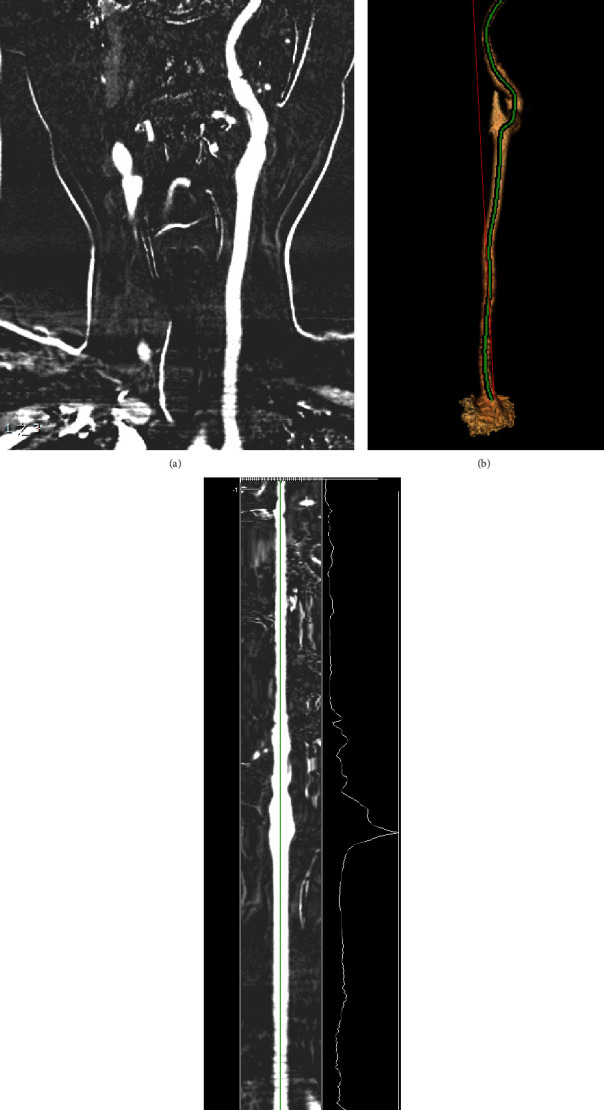
Figure 1.

Measurement of arterial tortuosity computed tomography angiography (CTA), illustrated by the example of carotid artery (CA). (a) Left CA in multiplanar reformation. (b) The straight length (red line) and actual length (green line) are measured in three-dimensional reconstructed CTA. (c) The green line represents the actual length of left CA by using curved planar reformat.
