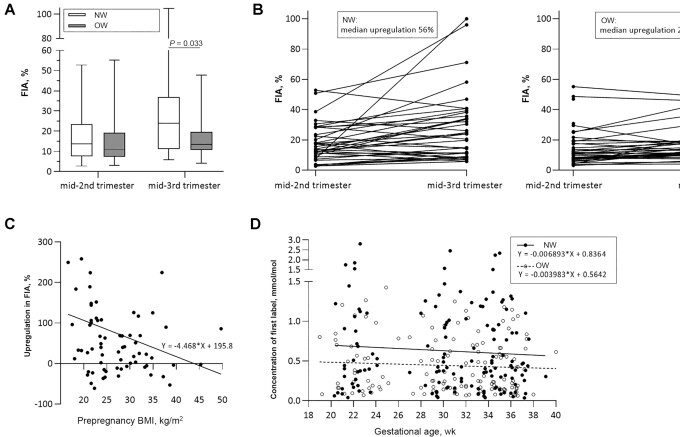
FIGURE 2.
FIA in NW and OW pregnant women. (A) FIA in NW and OW pregnant women during the second (NW: n = 39; OW: n = 37) and third trimesters (NW: n = 37; OW: n = 34), analyzed using independent-sample t test. Lines and boxes show the median and IQR, whiskers show the range. (B) Upregulation in FIA from the second to the third trimester in NW and OW pregnant women. The increase in median [IQR] FIA from the second to the third trimester was 56% [−2% to 120%] in the NW group (n = 36) and 24% [−5% to 69%] in the OW group (n = 34) (P = 0.204). Analyzed using independent-sample t test. (C) Negative Spearman correlation between prepregnancy BMI and upregulation in FIA from the second to the third trimester, rs = −0.235, P = 0.050 (NW: n = 36; OW: n = 34). (D) The slope of circulating label concentration from pregnancy week 22 to 36 (reflecting overall iron absorption) was more negative in the NW group (n = 38) than in the OW group (n = 36), but this was not statistically significant (P = 0.197). Analyzed using independent-sample t test. FIA, fractional iron absorption; NW, normal-weight; OW, overweight/obese.

