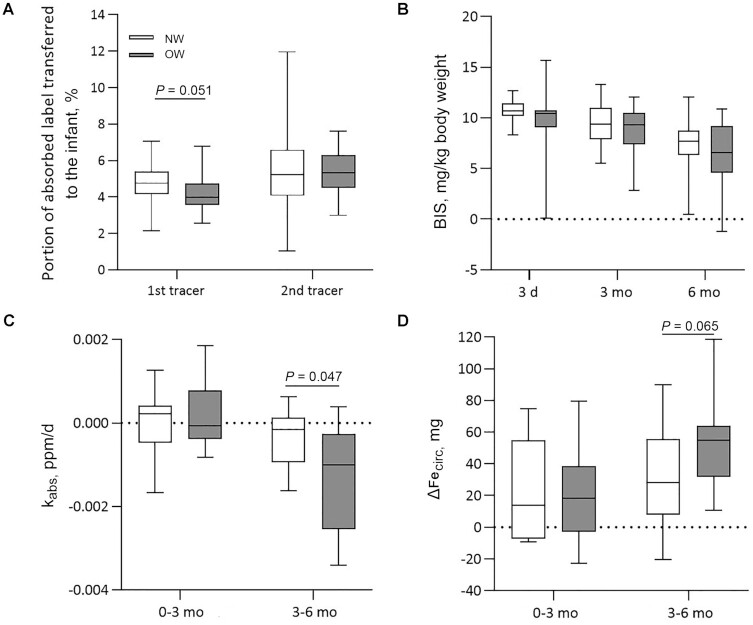
FIGURE 3.
Maternal–fetal iron transfer, iron status, and dietary iron absorption in infants born to NW and OW women ≤6 mo of age. Lines and boxes show the median and IQR, whiskers show the range. (A) Percentage of tracer transferred from the mother to the fetus, assessed in infant blood samples at 3 d of age. First administered tracer given in approximately PW 20 (NW: n = 21; OW: n = 22) and second administered tracer given in approximately PW 32 (NW: n = 22; OW: n = 22). NW women transferred a higher percentage of first tracer (P = 0.051) to their infants than did OW women. Analyzed using independent-sample t test. (B) Linear mixed-effect model analysis showed significant group (P = 0.024) and time (P < 0.001) effects on infants’ BIS over the first 6 mo of life with higher BIS in infants born to NW mothers (NW: n = 31; OW: n = 31). (C) kabs, calculated as the rate of dilution of the first administered tracer during the first and second 3 mo of life (NW: n = 12; OW: n = 11), was significantly more negative in infants of the OW group than in those of the NW group (P = 0.047). Analyzed using independent-sample t test. (D) ΔFecirc during the first and second 3 mo of infants’ life (NW: n = 12; OW: n = 11) showed a trend for being higher in the infants of the OW group (P = 0.065). Analyzed using independent-sample t test. BIS, body iron stores; kabs, fraction of total body iron absorbed per day; NW, normal-weight; OW, overweight/obese; PW, pregnancy week; ΔFecirc, changes in circulating iron.

