Figure 3 .

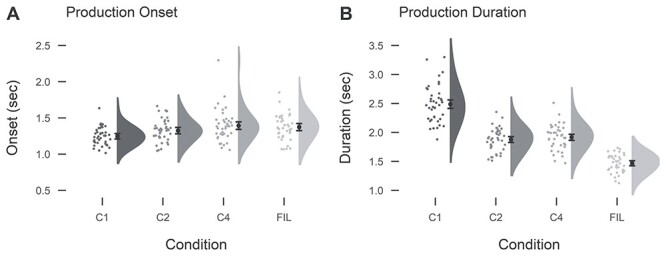
Onset (A) and duration (B) times per condition (of correct trials only). Black dots indicate mean with standard error of the mean. Gray dots represent individual participants’ mean.

Onset (A) and duration (B) times per condition (of correct trials only). Black dots indicate mean with standard error of the mean. Gray dots represent individual participants’ mean.