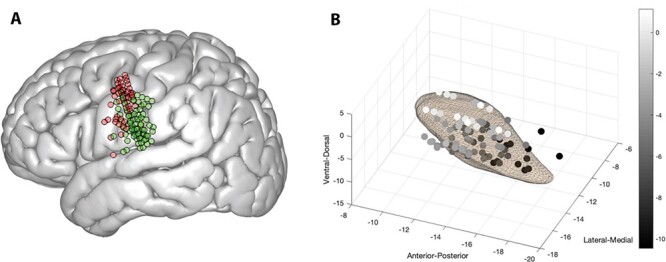
Figure 2 .

Recording locations. (A) Cortical recording locations in precentral gyrus represented in red dots, and postcentral gyrus represented in green dots. Note that one subject is not represented here in common space because transformation to MNI space could not be completed due to low imaging quality. (B) Subthalamic nucleus recording locations in MNI coordinates. Depth, as represented in MNI coordinates, is depicted in greyscale to highlight depth differences.
