
Figure 4 .
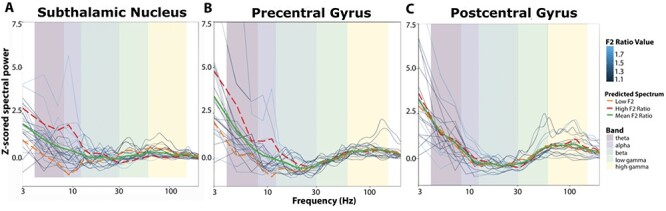
Local field potential spectral power across frequencies around vowel onset as a function of formant ratio (F2 Ratio). (A) In the 200 ms surrounding vowel onset, the z-scored spectral power was predicted by a linear model using F2 Ratio as a predictor (see Equation 2) in the subthalamic nucleus. (B) Linear model predicting F2 Ratio in the precentral gyrus and (C) Linear model predicting F2 Ratio in the postcentral gyrus. In all figures, raw neural data are shown in the blue lines, color coded by corresponding F2 Ratio. Predicted spectral data are displayed in orange, red, and green to demonstrate patterns in variation as a function of speech gain (F2 Ratio) (see methods for details). Frequency bands are outlined in pastel colors to denote cut offs for the canonical frequency bands utilized in further analysis (Figs 5 and 6).