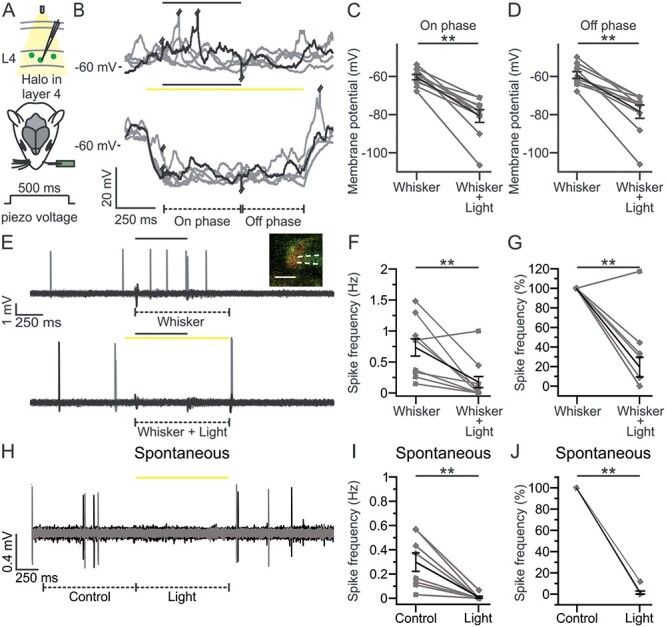
Figure 2.

Halo-mediated inhibition of L4 excitatory neurons during whisker stimulation. (A) Schematic representation of the experimental configuration for electrophysiological recordings in L4 excitatory neurons expressing Halo (green cells) in S1bf of anesthetized mice. A single whisker contralateral to the injected hemisphere was spared and stimulated using a glass capillary connected to a piezo actuator (whisker deflection duration: 500 ms). Yellow light was delivered to the barrel cortex through a fiber optic (duration of optogenetic stimulus: 1 s). In this as well in other figures, opsin-positive cells are colored, whereas opsin-negative cells are indicated in gray. (B) Five representative traces of membrane potential responses recorded in the whole-cell configuration from a L4 Halo-positive neuron during whisker stimulation in the absence (top) or presence of optogenetic inhibition of L4 (bottom) in anesthetized mice. In this as well as in other figures, the black and the yellow bars represent the timing of the whisker stimulus and of the optogenetic illumination, respectively. Piezo artifacts and APs were truncated when necessary for presentation purposes. Whisker responses were divided into 2 phases: on phase (from 10 to 500 ms after the whisker stimulation onset) and off phase (from 10 to 400 ms after the end of the deflection). (C) Membrane potential of Halo-positive cells during the on phase of the whisker stimulation in the absence (Whisker) or presence of yellow light illumination (Whisker + Light). n = 10 cells from 8 animals; Wilcoxon signed rank test, P = 2E-3. In this as well as in other figures, the values from individual cells are shown in gray, the average of all cells in black. Error bars indicate SEM. (D) Same as in C, but during the off phase of the whisker response. n = 10 cells from 8 animals; Wilcoxon signed rank test, P = 2E-3. (E) Ten representative traces from a 2-photon guided juxtasomal recordings from a TdTom+ L4 cell coexpressing Halo during whisker stimulation alone (top) or during combined optogenetic inhibition of L4 (bottom) in anesthetized mice. The dashed lines below the traces indicate time windows of 900 ms during whisker stimulation (Whisker) or during combined sensory stimulation and yellow light stimulation (Whisker + Light). Inset: 2-photon image showing the recording pipette and the recorded cell expressing Halo (green) and TdTom (red). Scale bar: 10 μm. White dotted lines indicate the glass pipette. (F) Spike frequency (Hz) of L4 TdTom+ neurons in the Whisker and Whisker + Light time windows. n = 12 cells from 10 animals; Wilcoxon signed rank test, P = 2E-3. In one out of 12 cells yellow light did not decrease the spike frequency suggesting that only 11 out of the 12 TdTom+ cells were also Halo+ cells (92%, in agreement with what shown in Fig. 1F). The sensory-evoked spike rate in the 11 light-responsive cells was reduced by yellow light stimulation (spike frequency: 0.72 ± 0.15 Hz [Whisker] versus 0.10 ± 0.05 Hz [Whisker + Light]; Wilcoxon signed rank test, P = 1E-3) to 11%. (G) Same as in F but normalized to the spike frequency during whisker stimulation (Whisker). n = 12 cells from 10 animals, Wilcoxon signed rank test, P = 3E-3. (H) Same as in E during spontaneous activity (Control) or during optogenetic inhibition of L4 (Light). (I) Same as in F for TdTom+ cells recorded under control conditions and during optogenetic inhibition of L4. n = 8 cells from 3 animals; Wilcoxon signed rank test, P = 8E-3. (J) Same as in I, but normalized to the spike frequency under control conditions (Control). n = 8 cells from 3 animals, Wilcoxon signed rank test, P = 8E-3. In this as well in the other figures: *P ≤ 0.05; **P ≤ 0.01; ***P ≤ 0.001.
