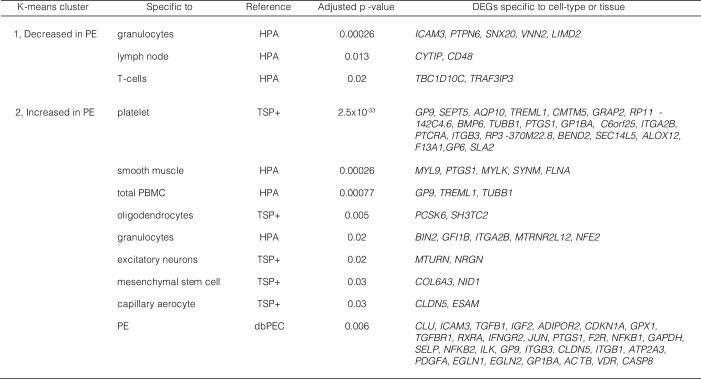
Extended Data Table 2.
Tissue, cell types, and genes previously implicated in preeclampsia enriched in 544 DEGs identified when comparing preeclampsia with or without severe features and normotensive pregnancies
For every significantly enriched tissue or cell type (P ≤ 0.05; one-sided hypergeometric test with Benjamini–Hochberg correction), assigned k-means cluster (Fig. 2d), reference and adjusted P values are reported from left to right. The rightmost column lists the gene names for all DEGs that were labelled as specific to a given cell type or tissue. The last row lists gene set enrichment with dbPEC, a preeclampsia-specific database of genes.

