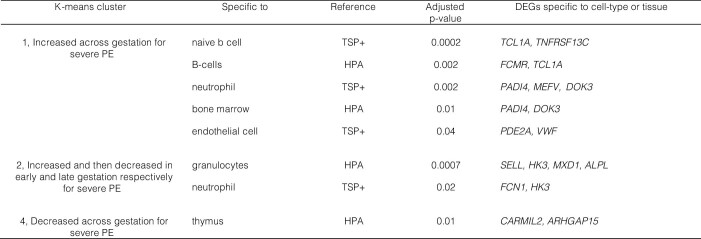
Extended Data Table 5.
Tissue and cell types enriched in 503 DEGs identified when comparing preeclampsia with as compared to without severe features
For every significantly enriched tissue or cell type (P ≤ 0.05; one-sided hypergeometric test with Benjamini–Hochberg correction), assigned k-means cluster (Fig. 4a), reference and adjusted P values are reported from left to right. The rightmost column lists the gene names for all DEGs that were labelled as specific to a given cell type or tissue.

