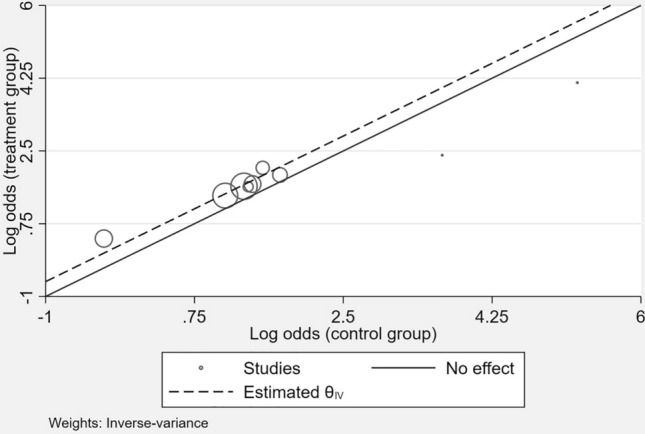
Fig. 1.

L’Abbé-plot of trials investigating the effects of SGLT2i on the composite outcome of hospitalizations for HF or CV death. CV cardiovascular, HF heart failure. The l’Abbé-plot plots the event rate in the experimental (intervention) group against the event rate in the control group. Trials in which the experimental treatment proves better than the control will be in the upper left of the plot, between the y axis and the line of equality. If experimental treatment is no better than control then the point will fall on the line of equality, and if control is better than experimental then the point will be in the lower right of the plot, between the x axis and the line of equality. The symbol size represents the sample size of the respective trials
