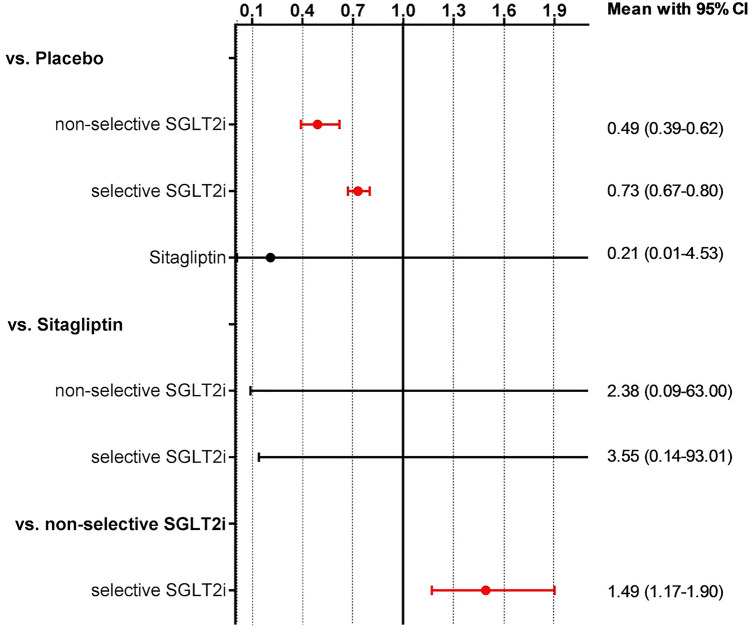
Fig. 4.
Predictive interval plot of selective vs. non-selective SGLT2i for the combined primary endpoint of hospitalization for HF or CV death. CV cardiovascular, HF heart failure, SGLT2i sodium-glucose cotransporter 2 inhibitor. The predictive interval plot represents a forest plot of the joint estimated summary effects from both direct and indirect comparisons along with their confidence intervals. Significant summary effects are shown in red

