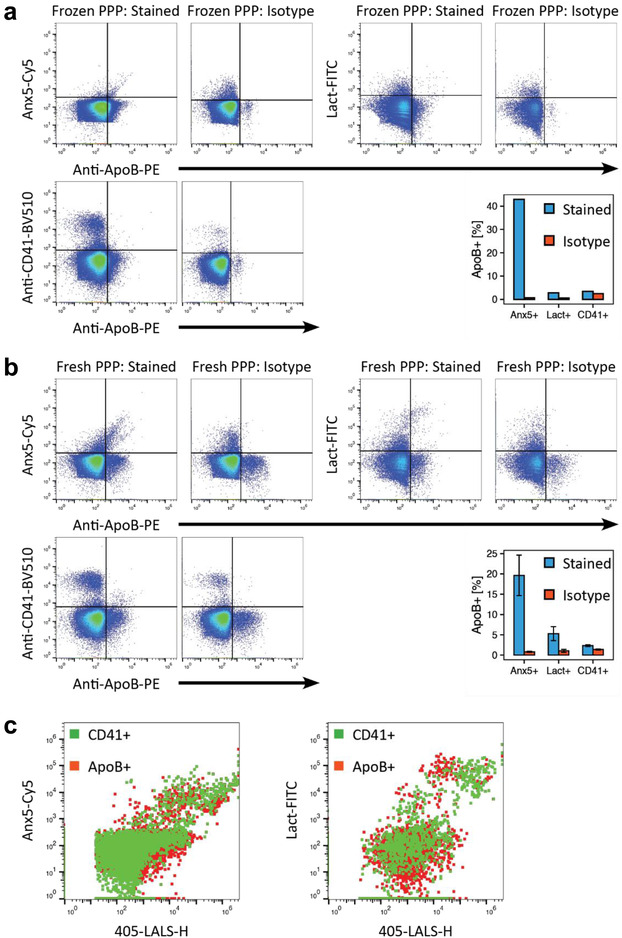
FIGURE 2.

Co‐staining of Anx5, lactadherin and CD41 with ApoB‐containing lipoproteins. (a and b) Scatter plots of Anx5‐Cy5, lactadherin‐FITC and CD41‐BV510 versus ApoB‐PE fluorescence depicting the degree to which markers co‐stain with ApoB in (a) a pool of PPP that was stored at −80°C after collection or (b) freshly collected PPP from one of three different individuals (representative data). Samples were either stained with Anx5 or lactadherin, as these markers both label PS. Bar plots depict the percentage of marker‐positive events that were also positive for ApoB in specifically stained samples (blue) versus isotype controls (red). Bar plots for fresh PPP depicts the mean and standard deviation (error bars) for three individuals. (c) Dot plots (large‐angle light scatter versus Anx5 or lactadherin fluorescence) of ApoB+ (red) and CD41+ (green) events demonstrate a significant overlap of these populations on these parameters. Light scatter and fluorescence intensities are denoted in arbitrary units. Anx5: Annexin V; ApoB: Apolipoprotein B; CD41: Cluster of differentiation 41/platelet membrane glycoprotein IIb‐IIIa complex; Lact: Lactadherin; LALS: Large‐angle light scatter (side scatter); PPP: Platelet‐poor plasma
