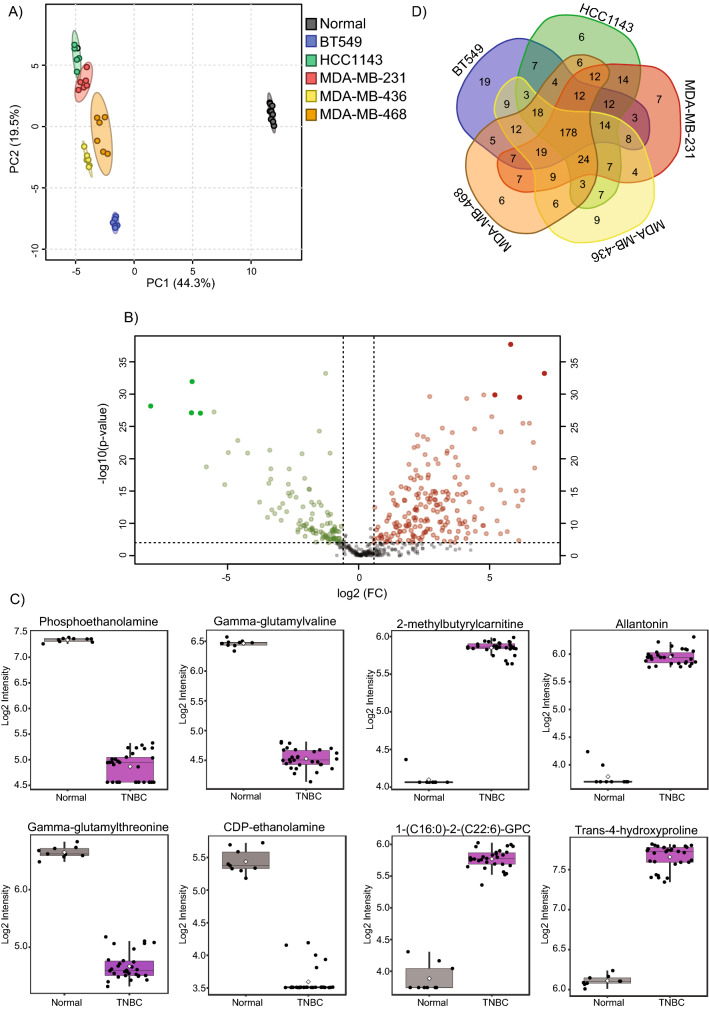
Fig. 1.
Metabolic signatures of TNBC cell lines. A PCA analysis reveals metabolic differences between normal and TNBC cell lines. B Volcano plot of metabolic features that significantly (with FDR p-value < 0.01 and fold-change ≥ 1.5 or ≤ −1.5) differ between normal and TNBC cell lines. C Box plots of metabolic features that show the strongest differences between normal and TNBC cell lines. D Venn diagram of similarities and differences across TNBC cell lines relative to normal cells

