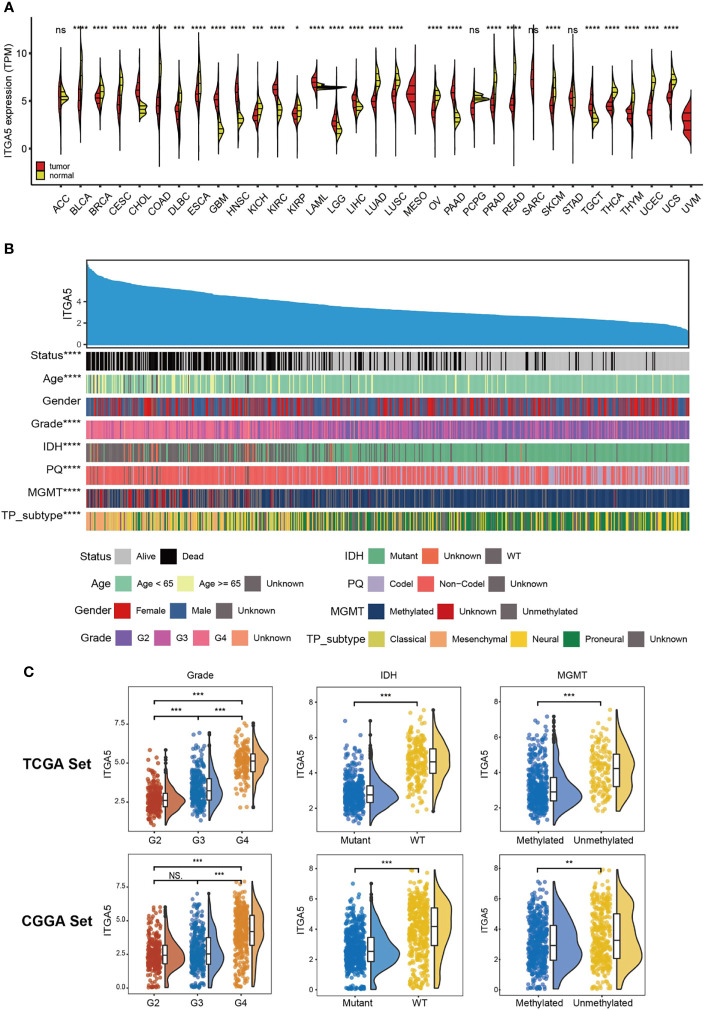
Figure 1.
The clinical and molecular characteristics in associations with ITGA5 expression. (A) ITGA5 levels among pan-cancer samples grouped by cancer and normal status from TCGA and GTEx. (B) An overview of the association between known clinical and molecular features in TCGA, namely, status, age, gender, grade, IDH mutation, 1p/19q codeletion, MGMT methylation, and TP subtype. (C) The expression levels of ITGA5 in different WHO grades, IDH states and MGMT methylational states from the TCGA and the CGGA datasets. NS, not statistically significant, *P < 0.05, **P < 0.01, ***P < 0.001, ****P < 0.0001.

