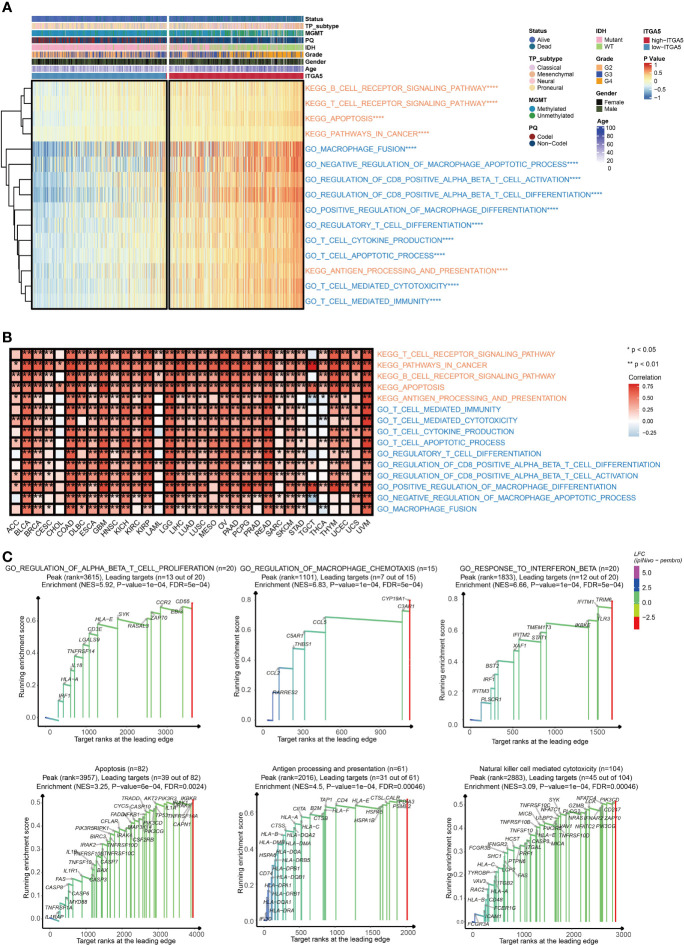
Figure 3.
The functional annotation based on ITGA5 expression. (A) The heatmap for gene set variation analysis of the ITGA5 from the TCGA. *P < 0.05, **P < 0.01, ***P < 0.001, ****P < 0.0001. (B) The heatmap showing the relationship between the above pathways and ITGA5 in the TCGA pan-cancer cohorts. (C) GSEA plots for several signaling pathways positively regulated by ITGA5.

