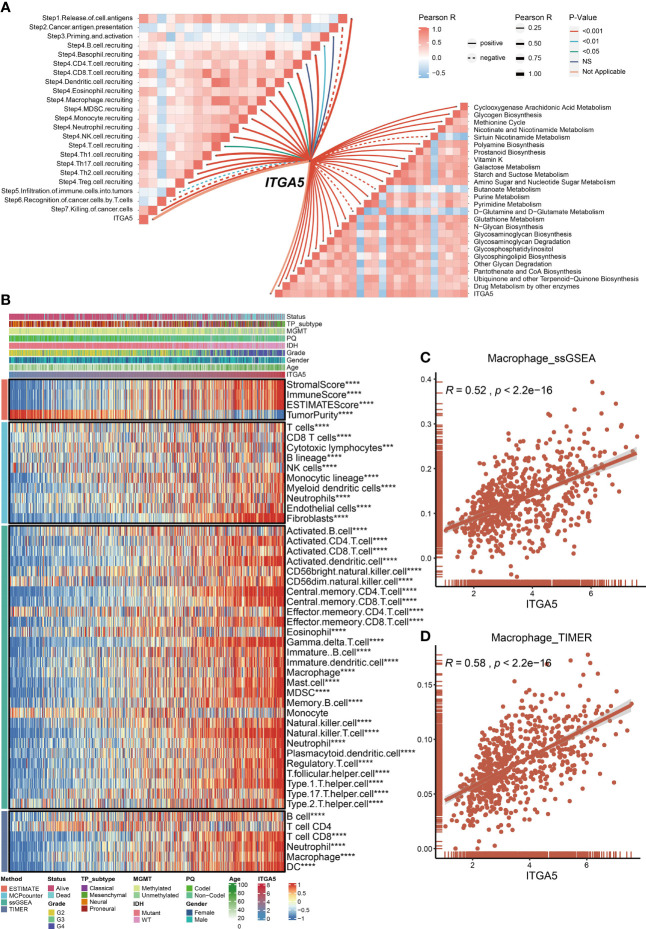
Figure 5.
Roles of ITGA5 in immune and metabolism phenotypes in the TCGA cohort. (A) Correlations between ITGA5 and enrichment scores of metabolism-relevant pathways together with the steps of the cancer immune cascades. (B) Heatmap visualized the abundance of infiltrating immune cell populations with different ITGA5 levels, based on the ESTIMATE, the MCPcounter, the ssGSEA, and the TIMER algorithms. *P < 0.05, **P < 0.01, ***P < 0.001, ****P < 0.0001. (C) The corrplot of the correlation between ITGA5 expression and macrophage cell level of the ssGSEA. (D) The corrplot of the correlation between ITGA5 expression and macrophage cell level of the TIMER.

