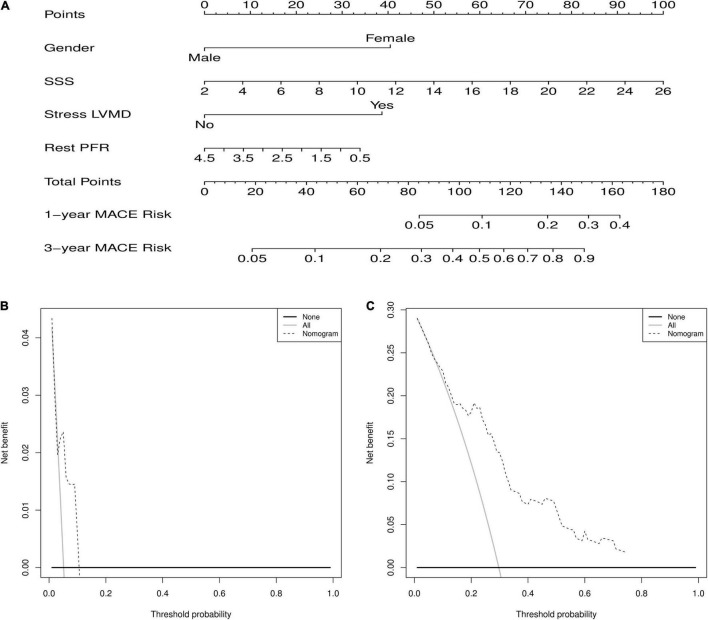
FIGURE 5.
(A) Nomogram for predicting 1 and 3 years of MACEs risk. For individualized predictions, a vertical line is drawn upward based on the patient’s characteristics to calculate the corresponding total score. The 1-year and 3-year MACEs risk is then calculated by drawing a vertical line down from “Total Points” based on the sum. (B) Decision curve analysis for 1-year predict. (C) Decision curve analysis for 3-year predict.

